
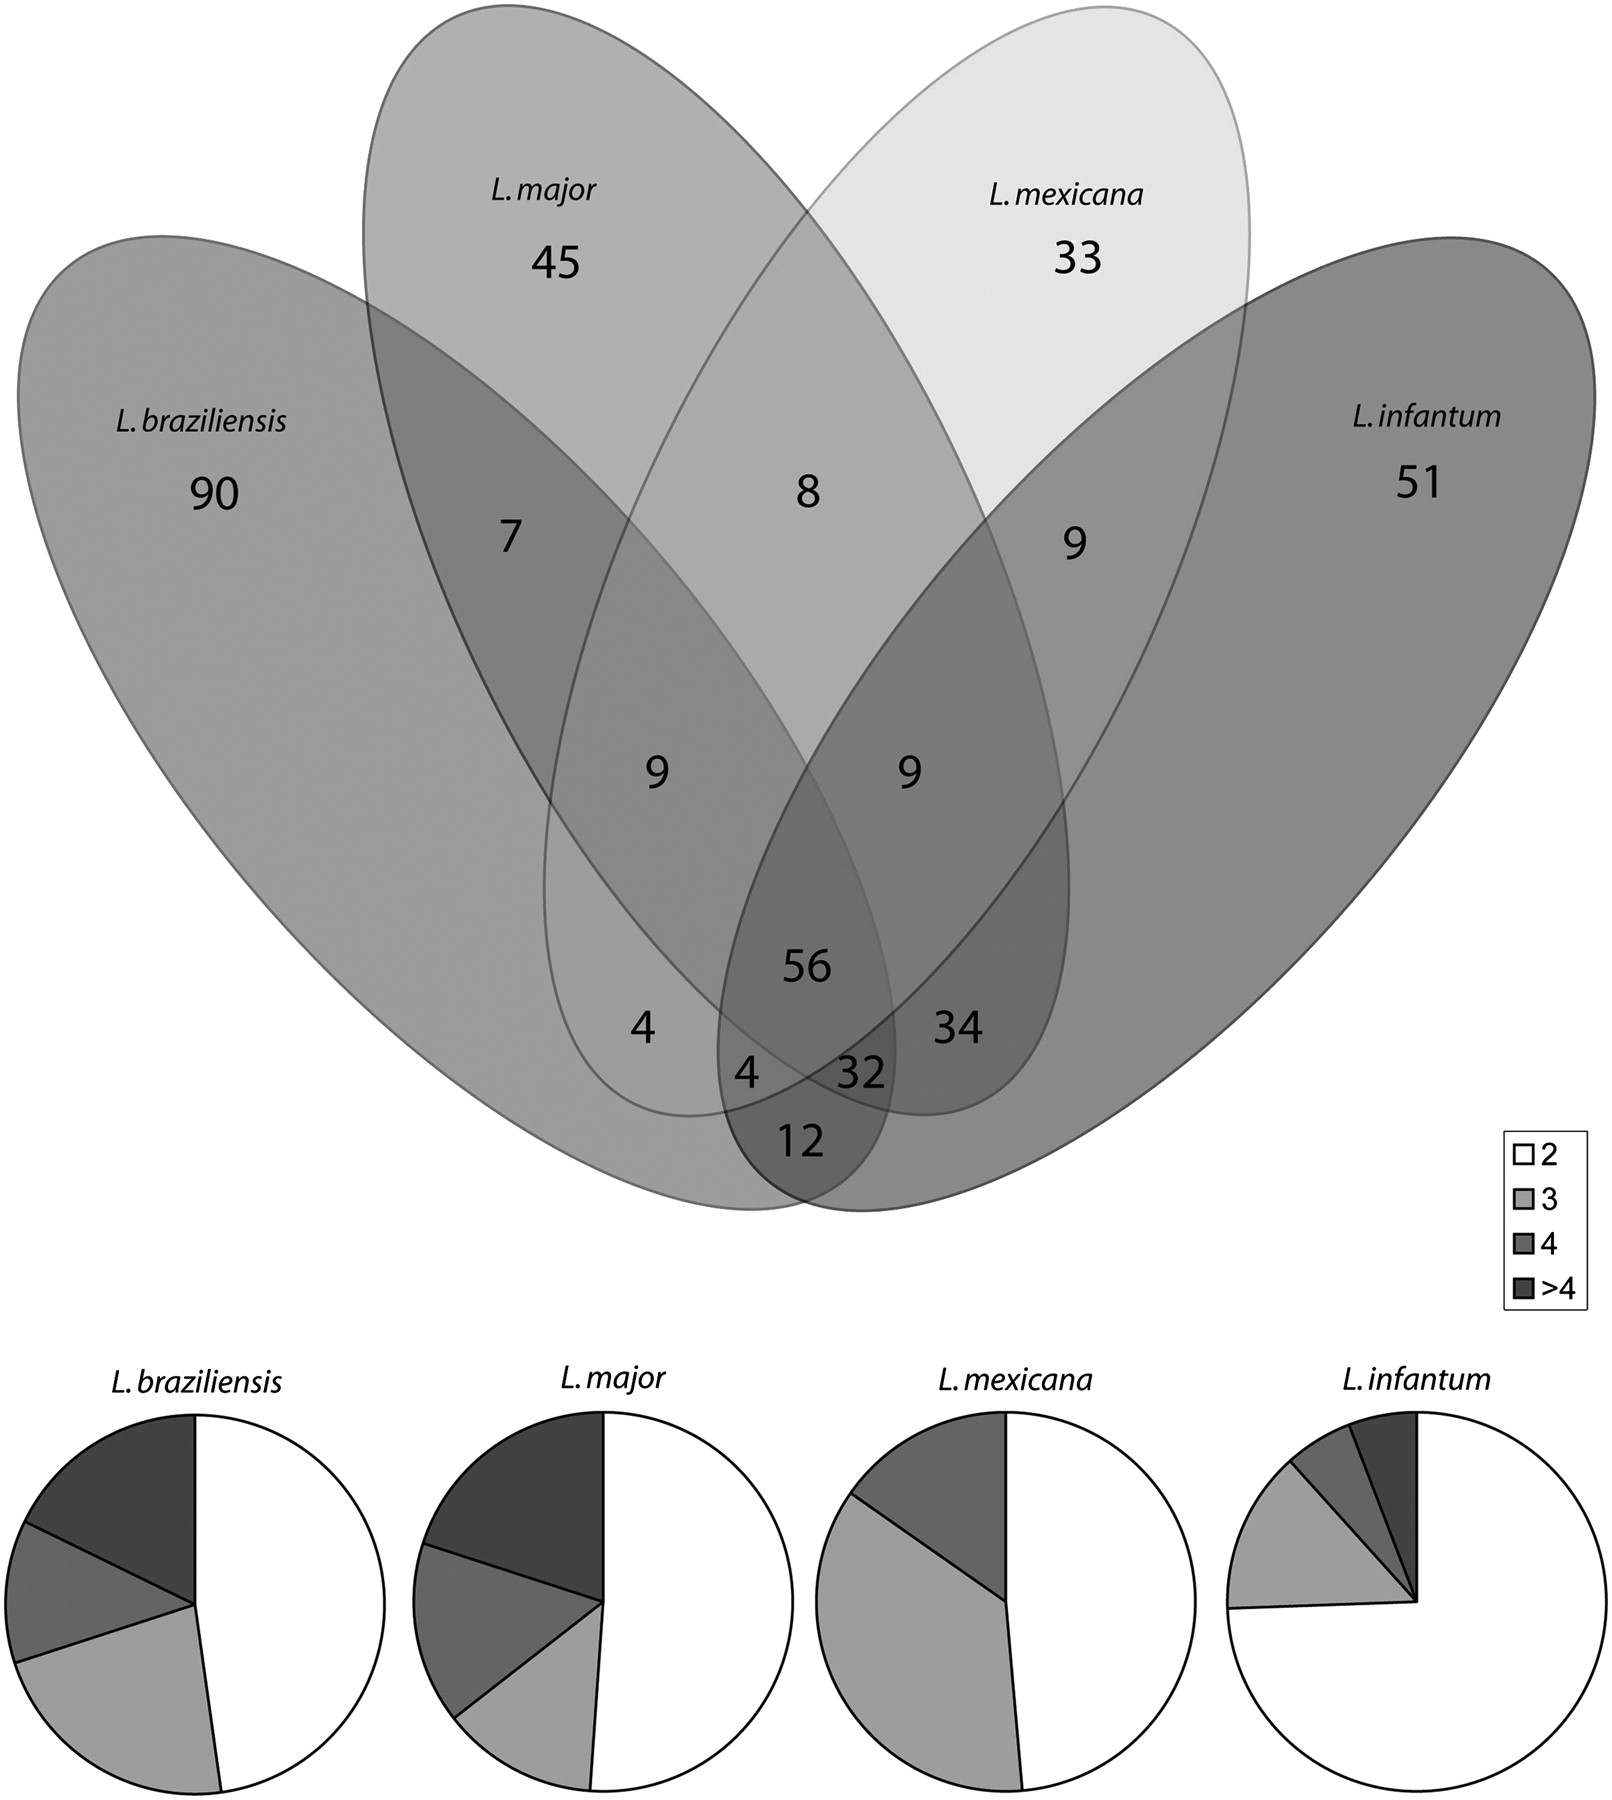
Figure 2.
Variation in multicopy arrays in the Leishmania reference genomes. Venn diagram that shows the overlap of arrays present in the different species, by unique ortholog group identifier for ease of comparison. Pie charts indicate the proportion of unique arrays grouped by the number of genes.


