
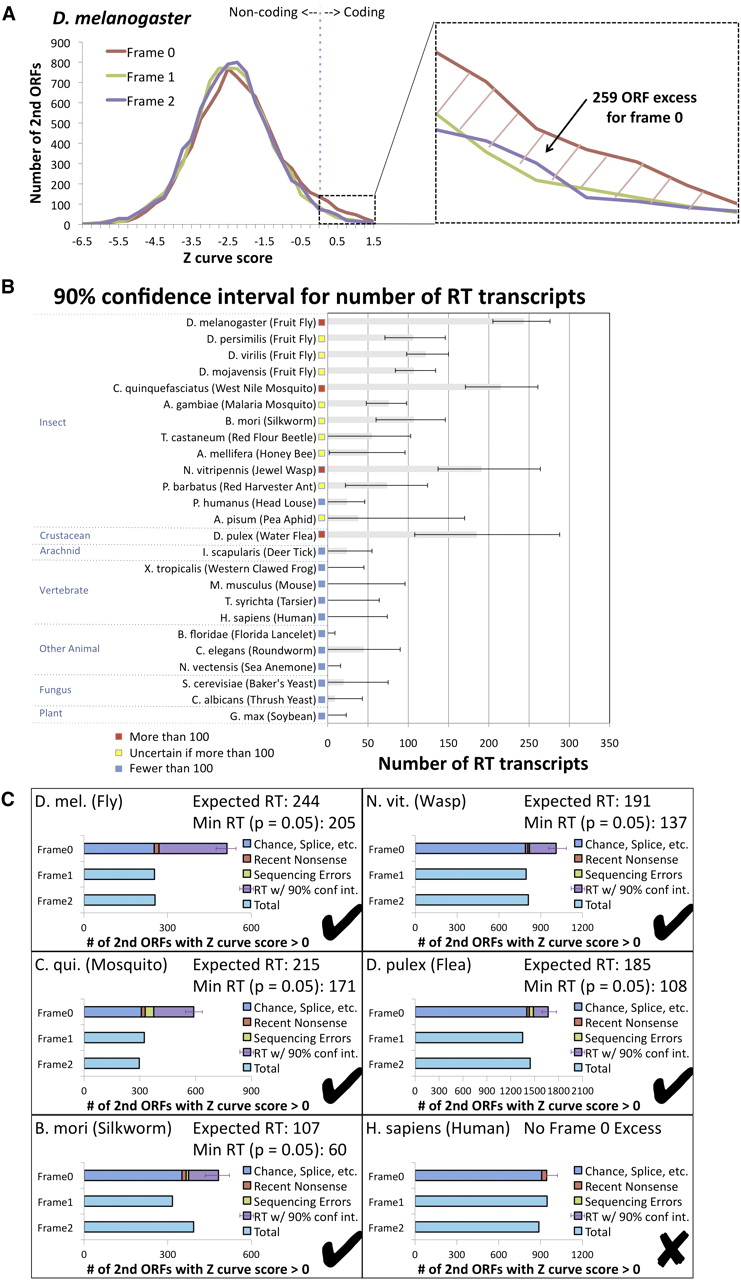
Estimated abundance of readthrough in insects and other eukaryotic species using single-species evidence. Estimated number of readthrough transcripts in 25 species, calculated using single-species sequence-composition evidence quantified by Z curve scores for downstream ORFs in three frames to detect excess of positive scores in frame 0 associated with abundant readthrough (RT). (A) Distribution of Z curve scores in three frames providing a single-species estimate for D. melanogaster consistent with our PhyloCSF-based estimate (Fig. 5A). Even though the Z curve does not provide sufficient power to detect individual readthrough genes, the excess of 259 positive Z curve scores for frame 0 nonetheless provides a robust single-species estimate of the overall abundance of readthrough in D. melanogaster. Because the histogram excludes second ORFs shorter than 10 codons long and uses a conservative threshold for detecting coding regions, this number should be interpreted as a lower bound. (B) Estimated number of readthrough transcripts with 90% confidence intervals for 25 species. Estimated number of readthrough transcripts is dozens or more for each of the insects tested, and for three insects and one crustacean, even the low end of the confidence interval is more than 100 transcripts, whereas none of the other species tested has more than 100 readthrough transcripts even at the high end of the confidence interval, suggesting that this level of abundant readthrough is specific to insects and crustacea. (C) Contribution of several potential mechanisms to the number of positive-scoring frame 0 transcripts for humans and five species with abundant readthrough. Horizontal bars show the number of positive scores in each of the three frames, with the frame 0 bar divided into estimates of the number of transcripts resulting from each of four potential mechanisms: positive scores that could occur in any frame, such as chance or splicing, estimated using the counts for the other two frames (blue); recent nonsense mutations, estimated using comparative information from D. melanogaster (red); sequencing mismatches, estimated using a homology test and simulated sequencing errors (green); and readthrough, obtained by subtracting the others from the total (purple). The error bar shows the 90% confidence interval for the number of readthrough transcripts, measured from the start of the readthrough portion of the bar, with the expected number of readthrough transcripts and lower end of the confidence interval reported in the title.


