
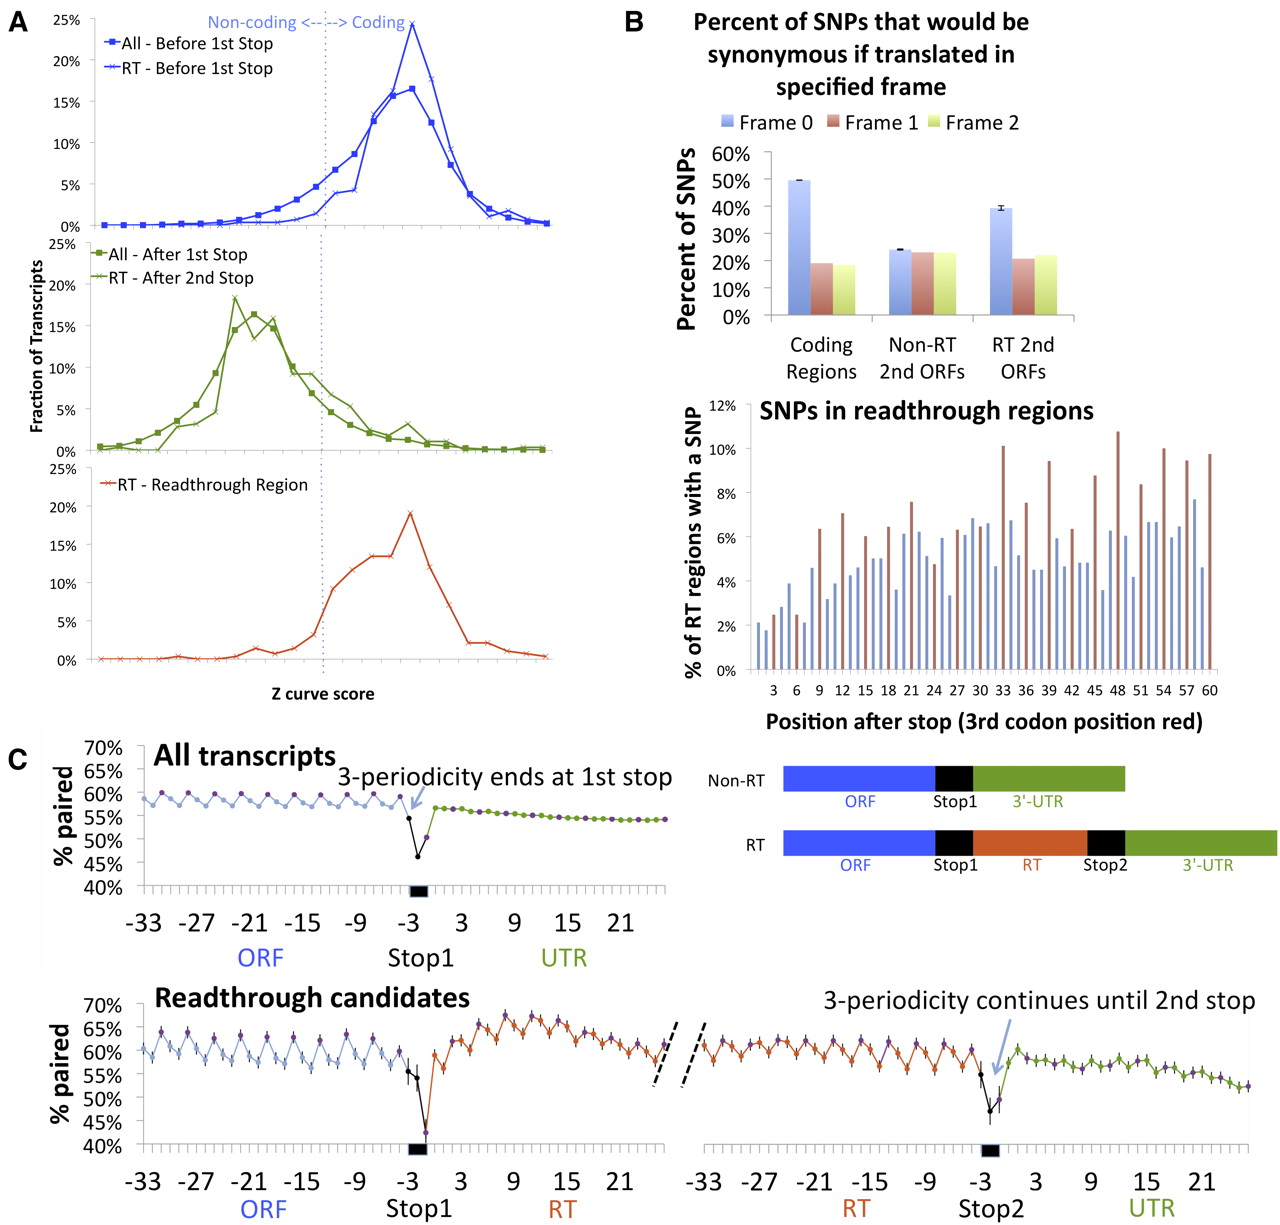
Single-species evidence of readthrough region translation. (A) D. melanogaster sequence composition of readthrough regions as measured by the Z curve statistic (x-axis) suggests they are protein-coding (positive scores). (Top panel) Coding regions before the first stop for both readthrough candidates (crosses) and non-readthrough transcripts (squares) show positive Z curve scores typical of protein-coding regions. (Middle panel) Non-coding regions after the second stop for readthrough candidates (crosses) and after the first stop for typical transcripts (squares) show negative Z curve scores typical of non-coding regions. (Bottom panel) Readthrough regions show positives scores typical of protein-coding regions, providing single-species evidence that most readthrough regions are protein-coding. Evaluated regions in all panels were selected to match the length distribution of readthrough regions. (B) Single nucleotide polymorphisms (SNPs) show a strong bias to result in synonymous codon substitutions in readthrough regions (top right) and coding regions (top left), but no bias is seen in second ORFs downstream from non-readthrough stop codons (top middle), providing evidence that readthrough regions are under protein-coding selection within the D. melanogaster population. For each type of region we show the fraction of SNPs that would be synonymous if translated in each of three frames, with frame 0 matching the translated frame of the coding region of the gene. Error bars show the Standard Error of the Mean (SEM). As most third codon positions result in synonymous substitutions, the exclusion of non-synonymous substitutions is also visible as a periodicity in the fraction of readthrough candidates that have an SNP at each position of the second ORF (bottom panel), with third-codon-position SNPs (red) more prevalent than first or second-codon position SNPs (blue). This plot also shows an overall decrease in the number of SNPs near the readthrough stop codon, likely due to additional signals involved in regulating readthrough, such as RNA structures, encoded within the protein-coding signal. (C) Periodic base-pairing frequency in readthrough regions (red) matches that of known coding regions (blue) but is different from that of UTRs (green). Fraction of transcripts for which a given nucleotide is paired in predicted RNA secondary structures (y-axis) at each position relative to a stop codon (x-axis). Third codon positions (purple) are paired more frequently than first or second positions, and stop codons (positions −3, −2, and −1) show decreased pairing, as previously observed computationally in humans and experimentally in yeast (top panel). Transition from periodic to non-periodic pairing happens at the second stop codon for readthrough candidates (bottom panel). Signal is averaged over five codon positions (see Methods), with raw data shown in Supplemental Figure S2. Error bars show the Standard Error of the Mean (SEM).


