
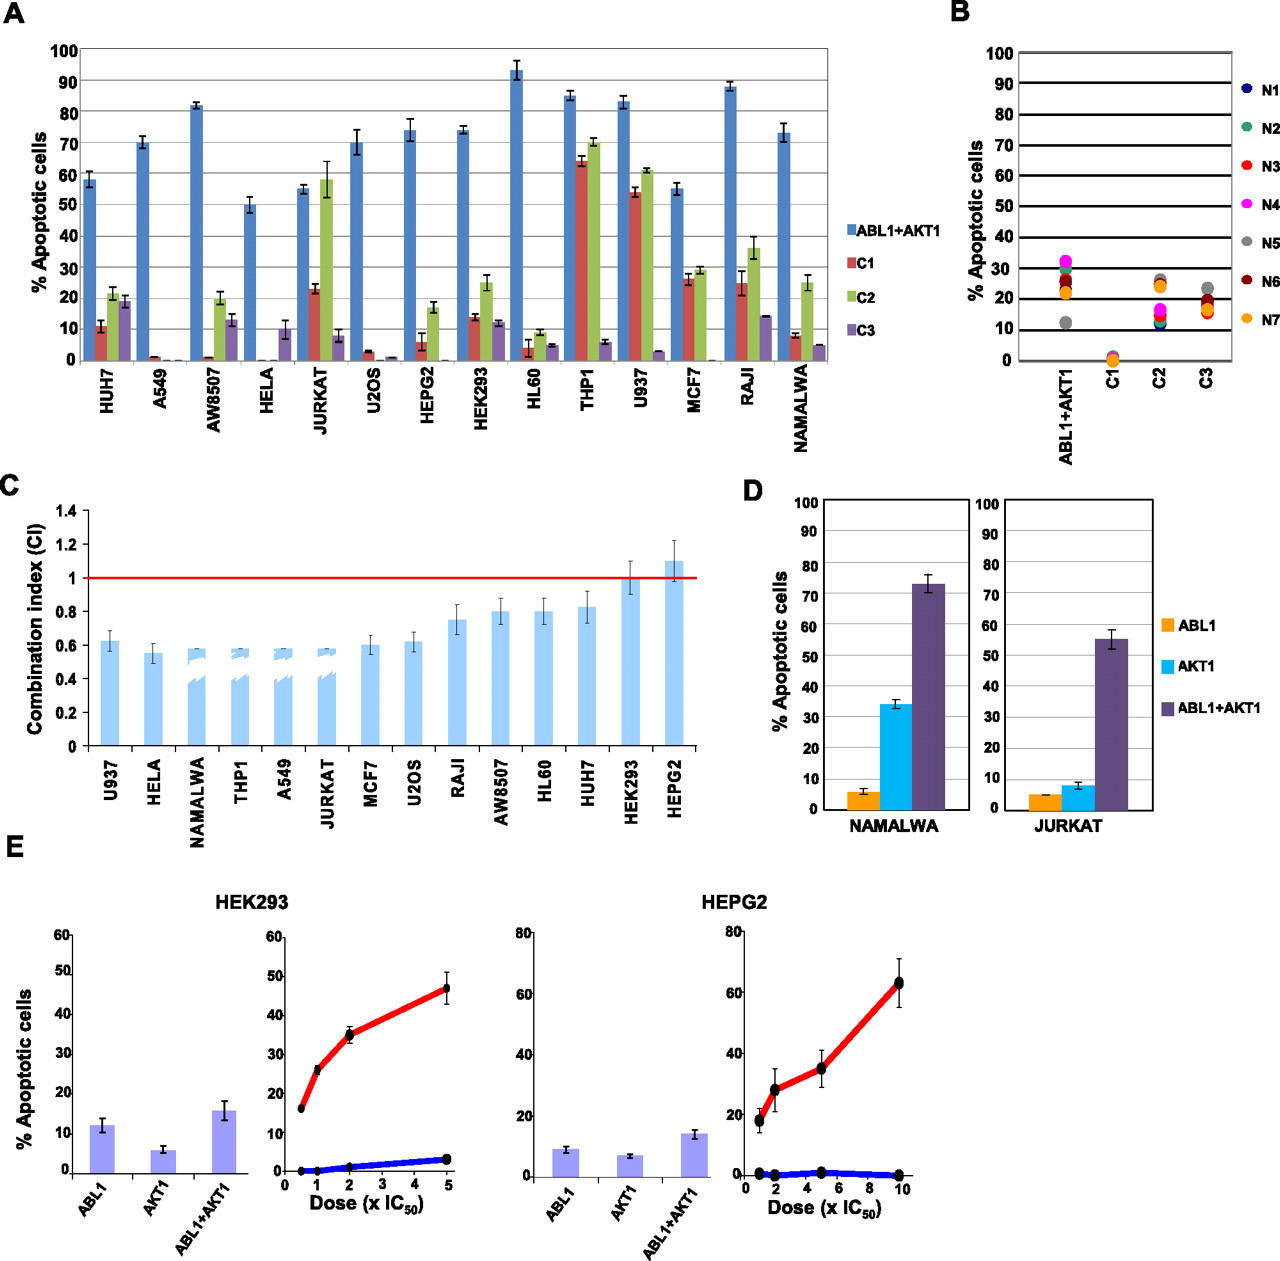
Vulnerable nodes constitute regulatory elements that are conserved across a broad range of cell types. (A) The effects of combined inhibition of the indicated kinase combinations (at concentrations of 5 × IC50 values) on 14 different cancer cell lines, following a protocol similar to that described for Figure 5F; (B) the results of a similar experiment with indicated inhibitor combinations performed on normal B-lymphocytes purified from the peripheral blood of six different individuals. (C) The CI values for the combined inhibition of AKT and ABL obtained for the individual cell lines. CI values were calculated as previously described (Chou and Talalay 1981). For four cell lines, CI values could not be estimated since either one (for Namalwa and THP1) or both (for Jurkat and A549) inhibitors showed no effect when added individually (indicated as broken bars). The red line defines the cutoff (CI = 1) for interpreting responses as being synergistic, and values are the mean (±SD) of three determinations. (D) Representative results for the synergy between AKT and ABL inhibition where one (Namalwa) or both (Jurkat) inhibitors were ineffective when added individually. (E) The effects of the inclusion of PP1a, in addition to LY294002 and imatinib mesylate, on the apoptotic responses of HEK293 and HEPG2 cells. Results are shown in two subpanels for each cell line, where the subpanel on the left indicates the effects either of LY294002, imatinib mesylate alone (each at 4 × IC50), or a combination of both. The subpanel on the right gives the results of the addition of increasing concentrations of PP1a either alone (blue line), or in the presence of the combined inhibitors for AKT and ABL (each at 4 × IC50, red line). Values again are the mean (±SD) of three determinations.


