
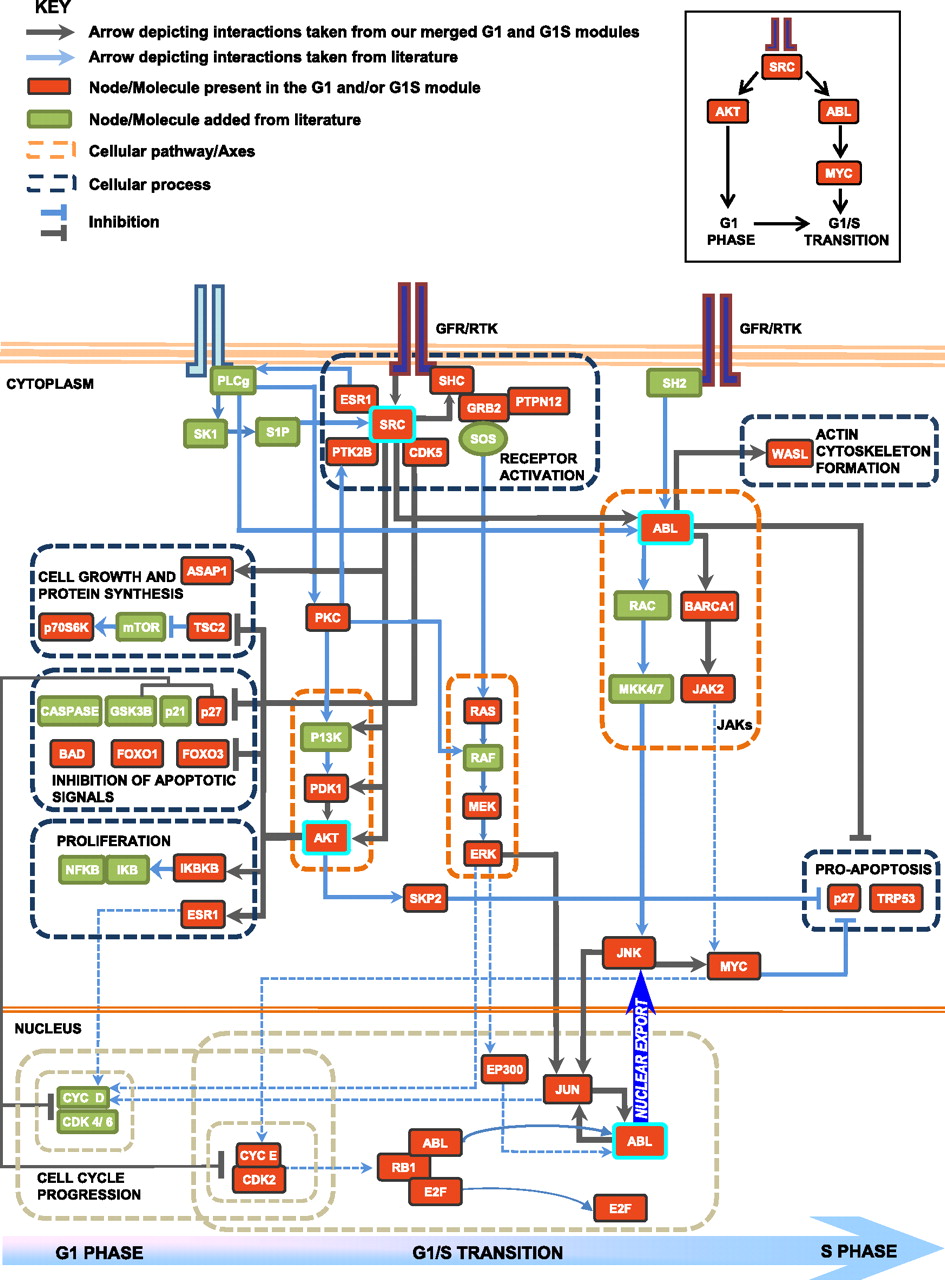
Network of core pathways that mediate commitment of cells to the division cycle. In the pathway model, the nodes in red are proteins that are present in the G1 and/or G1S modules. Nodes present in green are derived from the literature (they include intermediates or effectors of cellular processes captured by our merged modules). The gray arrows depict interactions taken from the merged G1 and G1S modules. The blue arrows are links added from the literature. The dotted orange boxes highlight cellular signaling pathways, and the dotted gray boxes group molecules involved in regulating similar cellular processes. The dashed blue arrows indicate a known role of the source node in regulating the target node, derived from the literature. AKT and PTK2B are G1-specific high-stress and betweenness nodes. SRC and GRB2 show high stress and betweenness in both modules. ABL and JUN are present as high-stress betweenness nodes only in the G1S modules. A detailed description of the pathways captured is given in the Supplemental Material.


