
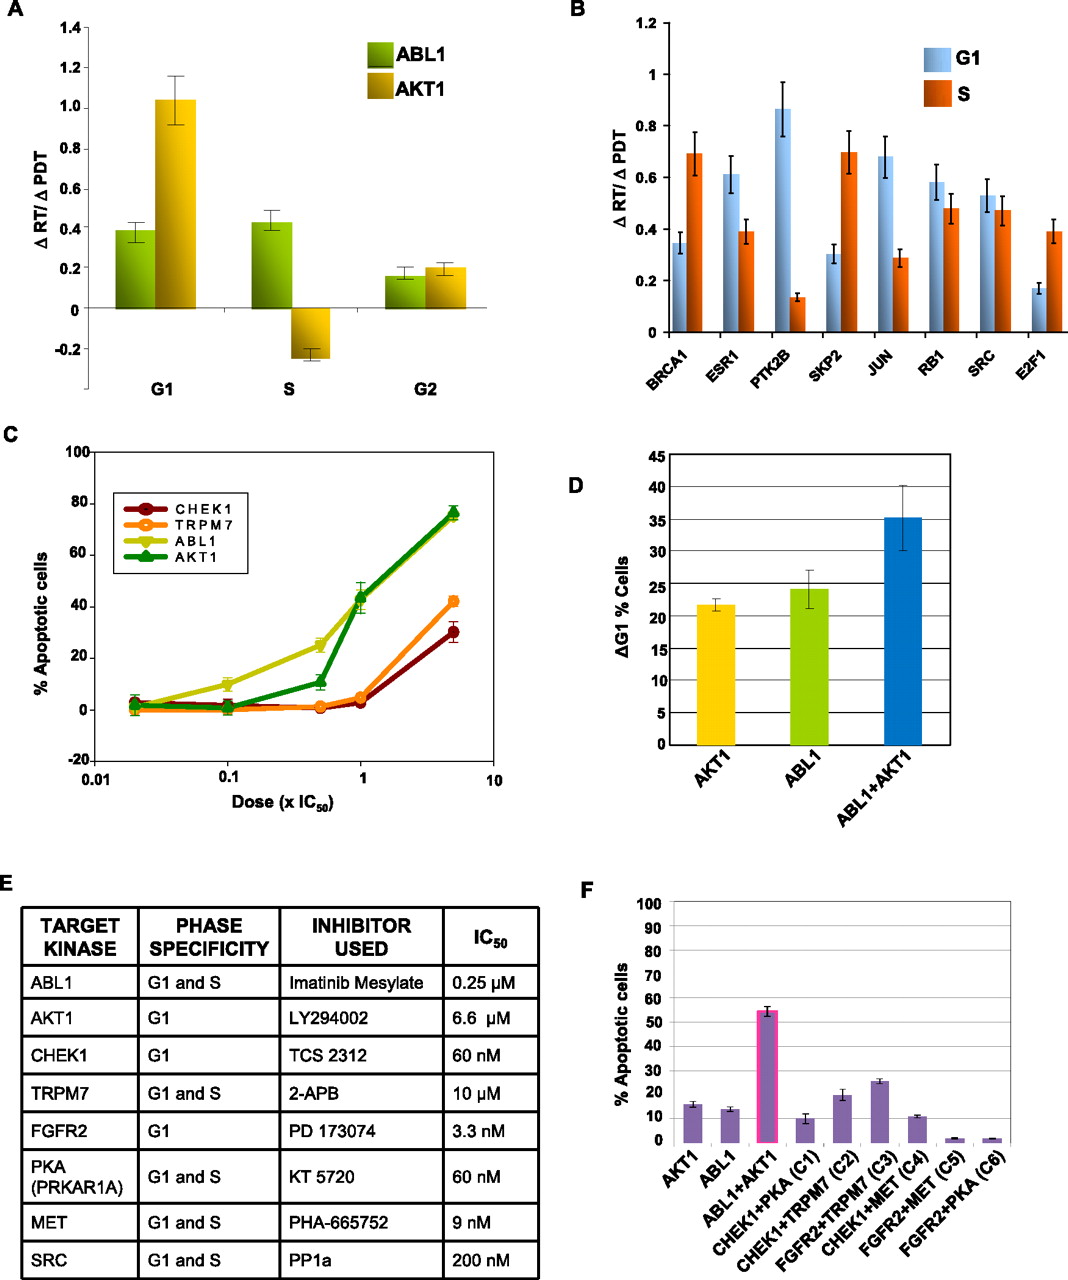
Vulnerable nodes provide targets for synergistic disruption of the cell cycle. (A) The effects of inhibition of either AKT or ABL on RTs of the individual phases. The increase in RT (ΔRT) of a given phase, relative to untreated cells, is expressed as a ratio of the corresponding increase—again relative to untreated cells—in PDT (ΔPDT). Here, LY294002 and imatinib mesylate were used at concentrations that were half of their respective IC50 values, and the increase in PDT obtained over that of untreated cells was 3 h. The effects of perturbation of the remaining high-stress, high-betweenness nodes identified in A are similarly shown in B. With the exception of SRC, where PP1a was used for inhibition, perturbation was achieved through siRNA-mediated depletion in all cases. Accordingly, the control cells used for the purposes of comparison were those treated with nonsilencing (i.e., GFP-specific) siRNA. The results for GRB2 and EP300 silencing are not included because high levels (>80%) of cell death were obtained in these cases. Values in both panels are the mean (±SD) of three independent experiments. No significant effect on RT of the G2 phase was noted in any of the cases. See also Supplemental Figure S4. (C) The dose-response profile for apoptosis in CH1 cells treated with pharmacological inhibitors of the indicated kinases. Doses for each inhibitor used were in multiples of their corresponding IC50 values as noted. Values (mean ± SD of three experiments) are expressed as the percent of apoptotic cells obtained 72 h later, after normalizing for spontaneous apoptosis. (D) The bar graph shows the corresponding accumulation of CH1 cells in the G1 phase obtained at 18 h with the 5 × IC50 concentration of inhibitors. Values (mean ± SD of three experiments) are expressed as the increase in percent of the G1 population, over that in untreated cells. (E) The target kinases examined, their phase specificity, the pharmacological inhibitors used for inhibition of these kinases, and the corresponding IC50 values of these inhibitors. (F) CH1 cells were treated with inhibitors against the indicated kinases (or kinase combinations), and the consequent effect on cellular apoptosis was determined 48 h later. The concentration of the relevant inhibitor used was fivefold greater than its corresponding IC50 value in all cases, and results are the mean (±SD) of three experiments. For panels C, D, and F, cells were treated with a single addition of the inhibitor or inhibitor combination.


