
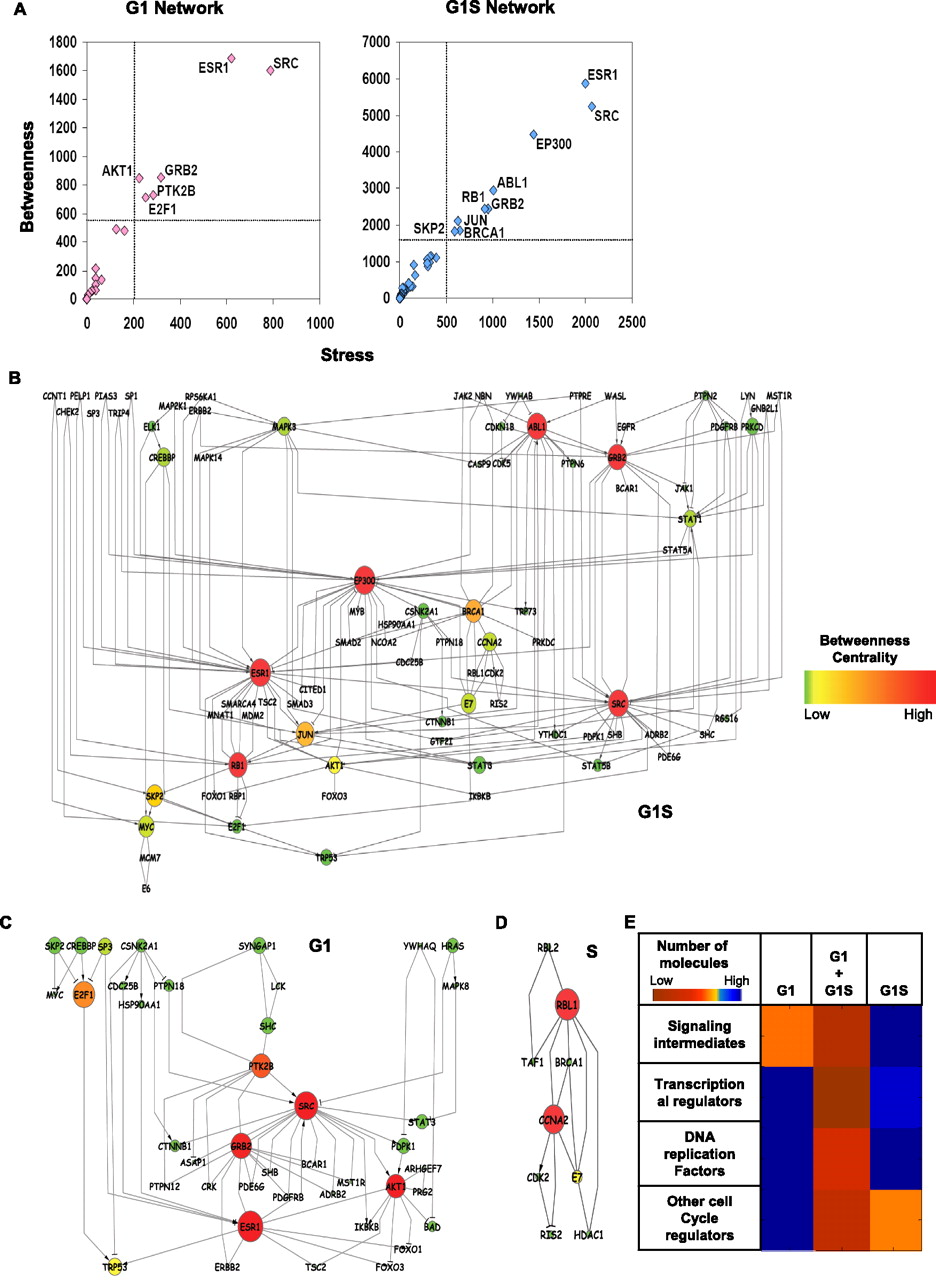
Delineating phase-specific regulatory modules and defining the vulnerable nodes. (A) Summary of the results of our analysis of centrality measures of the nodes in each of the phase-specific regulatory modules. This is depicted as a Stress-versus-Betweenness plot for all of the molecules in the G1 and G1S cell cycle modules. Only those nodes that are above the cutoff of 2.5 times that of the mean value (indicated by the dotted line; see text) are identified here. (B–D) The IMP node-based regulatory modules obtained for each of the individual phases. These represent phase-specific modules extracted by merging the motifs identified for the G1, G1S and S phases, respectively. The nodes are color-coded according to their betweenness centrality measure. The size of the nodes represents the stress parameter, where the size of the nodes increases with increasing stress value. The gradation of the betweenness values is defined by the color bar. (E) The stage-dependent modulation in biochemical activities of the core cell cycle regulatory network spanning from early G1 to completion of the S phase. This is presented as a heat map that defines the percent contribution of signaling, transcription regulatory, DNA replicative, and cell cycle regulatory molecules, in each of the indicated windows.


