
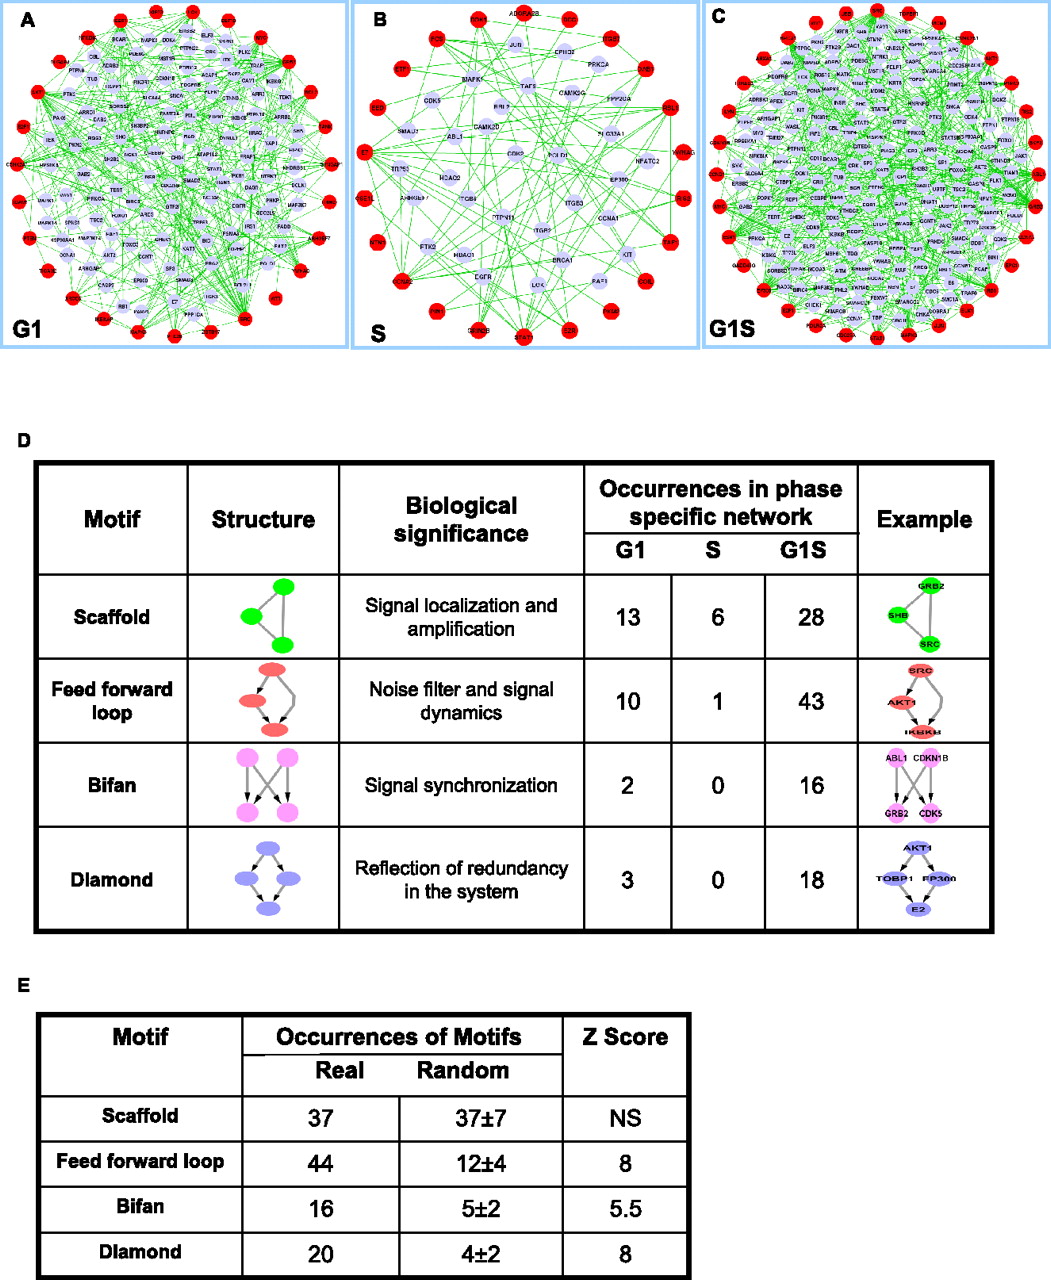
Extraction of phase-specific subnetworks and their constituent regulatory motifs. (A–C) The phase-specific IMP node subnetworks extracted from our cell cycle core network for G1, S, and G1S phase regulation. The IMP nodes are defined in red, while the blue nodes denote the intermediate node linking any two or more IMP nodes. (D) A compilation of the different functional motifs identified in each of the phases, along with a brief description of their biological implications. In addition, a typical topological representation of each kind of motif is also shown. Here both three- and four-node motifs in the FFL categories have been grouped together for the sake of convenience. (E) Comparison of the number of different motifs obtained for the integrated IMP node network (Real) versus that in a hundred randomized networks (Random, values given as mean ± SD). In these randomizations both the nodes and the number of links were kept at a constant. The statistical significance of the difference in numbers between the Real and Random cases is indicated by the corresponding Z-scores, which were calculated as (<Real> − <Random>)/SD). Here NS indicates that there was no significant change in the case of scaffolds. This is not surprising given that scaffolds are composed of undirected edges.


