
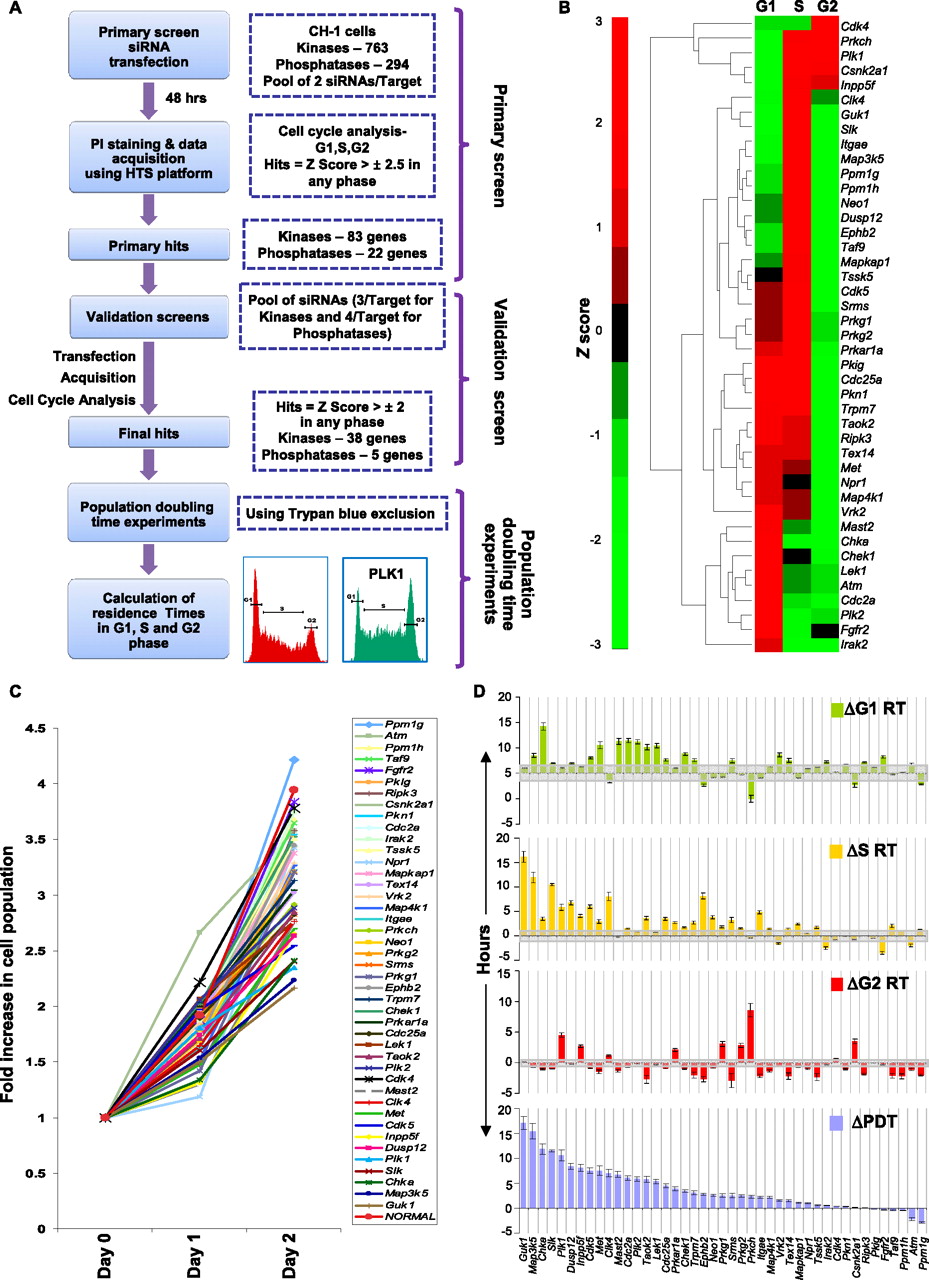
Design of the siRNA screen and the cell cycle phase–specific effects of the identified targets. (A) Schematic of the strategy used to identify genes involved in cell cycle regulation. The overall z-factor obtained for our screen was 0.56, confirming its high overall quality. Details of the design, assay validation, and target verification are provided in the text, Supplemental Experimental Procedures, and Supplemental Figures S1 and S2. (B) The hierarchical clustering of the siRNA hits according to the observed phenotype on cell cycle. The dendogram represents the various clusters of genes identified by our screen for the observed cell cycle distribution pattern. This pattern is based on the normalized z-scores of each of the siRNA hits in the respective cell cycle phases. (C) The range of observed changes in proliferation rate. The population growth curves of CH1 cells obtained in response to transfection with either nonsilencing siRNA (NORMAL), or with siRNA against each of the validated hits are plotted. Here, cells were plated at 48 h after siRNA transfection (Day 0), and results are plotted in terms of the fold increase in cell number at the indicated time points. Values are the mean of three separate determinations. The subset highlighted by the bracket indicates those target-specific siRNAs that produced a significant increase in the population doubling times (P-value < 0.05, as indicated by the asterisk). (D) A further analysis wherein the results in panels B and C were combined to determine the effects of siRNA-mediated target silencing on residence time (RT) of the individual cell cycle phases. Changes (Δ), relative to the corresponding values in GFP-silenced cells, in PDT and RT of the individual phases are shown here as the mean (±SD, gray bar) of three experiments. Details of their calculation are provided in Supplemental Figure S3.


