
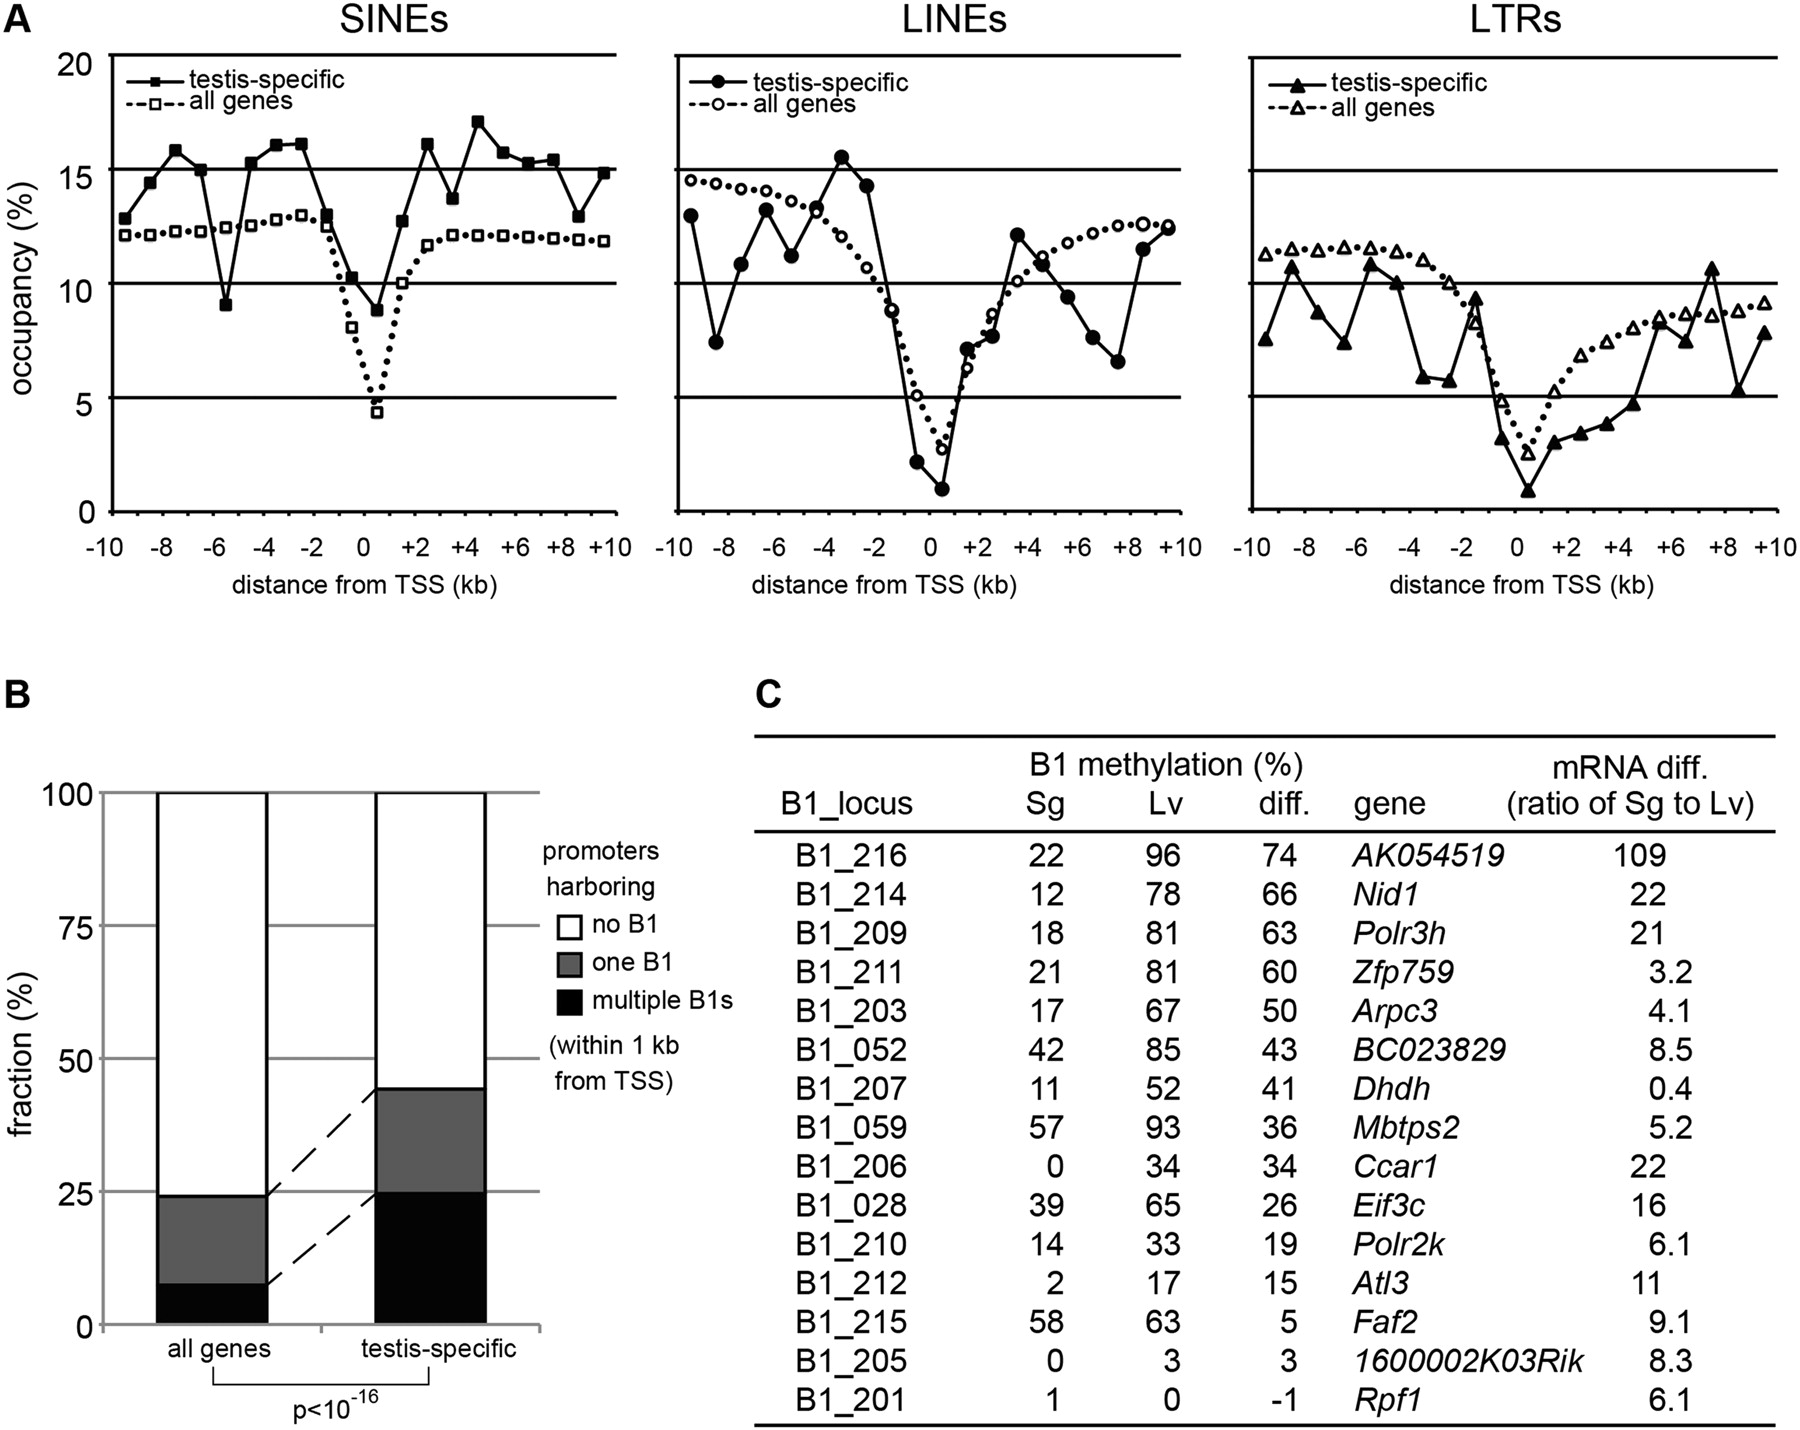
B1 methylation levels and gene expression. (A) Statistics for genomic occupancy of SINEs (squre), LINEs (circle), and LTR retrotransposons (triangle) in 1-kb bins are shown in relation to their distance from TSS for all (dashed lines) and testis-specific genes (solid lines). Testis-specific genes were listed previously (Weber et al. 2007). (B) Statistics for all and testis-specific genes that harbor 0 (white), 1 (gray), and >1 (black) B1 elements within 1 kb from TSS. (C) DNA methylation levels at B1 loci and expression levels of their neighboring genes. For each gene adjacent to a B1 locus, the relative proportion of mRNA levels in spermatogonia and liver (three biological replicates) was determined by quantitative RT-PCR.


