
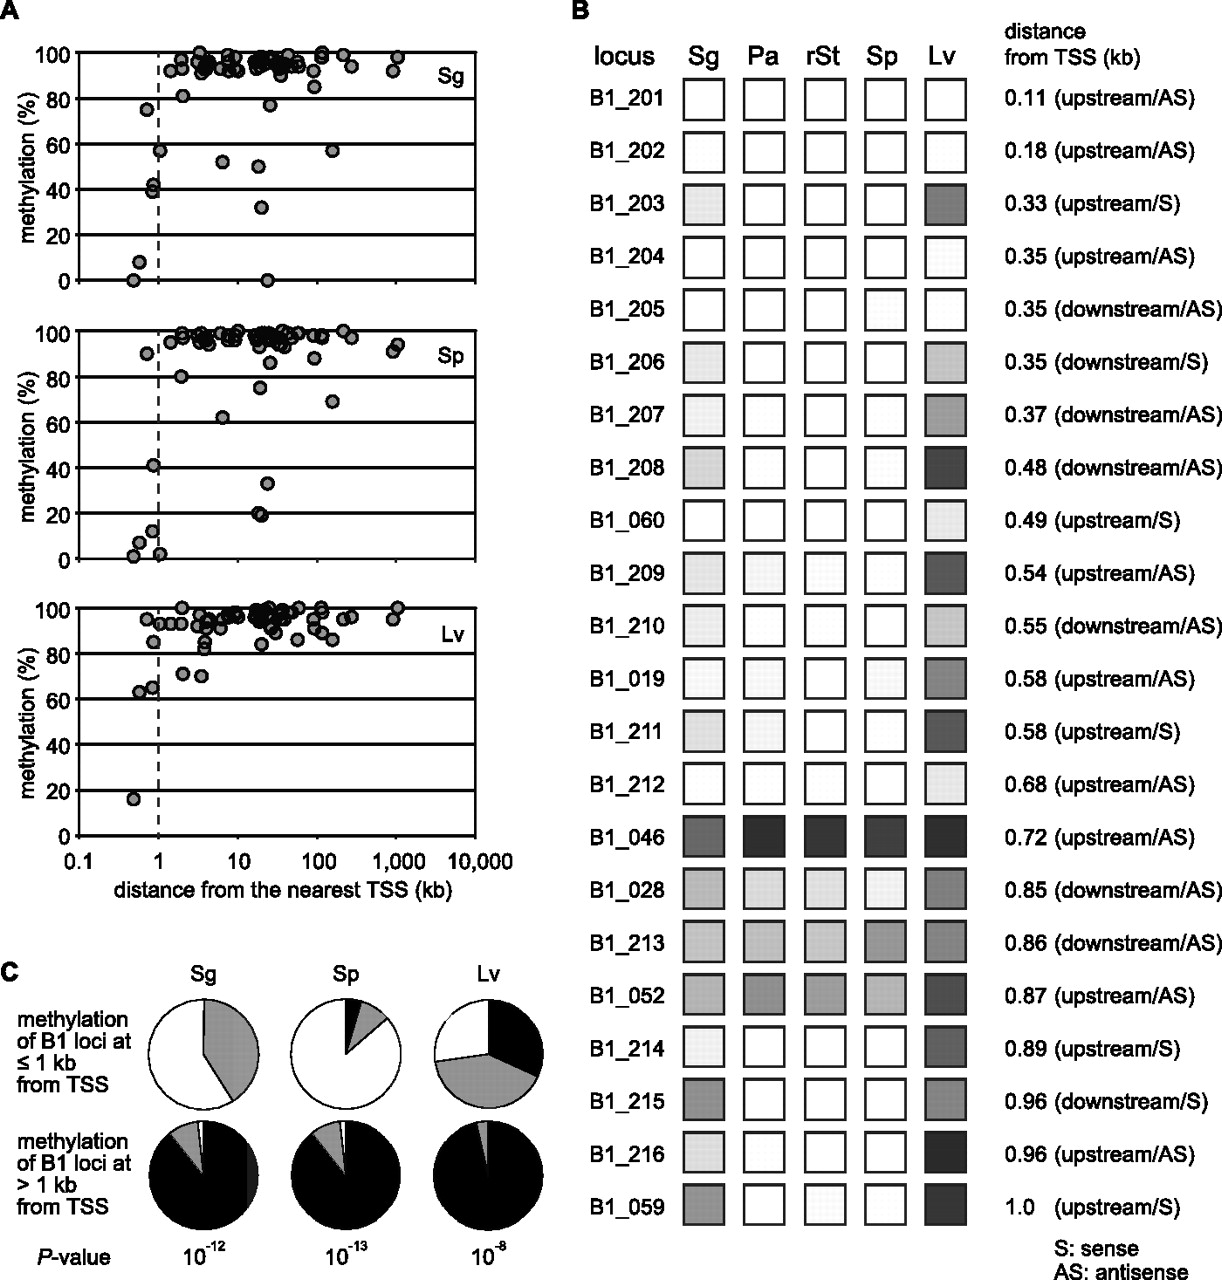
DNA methylation levels and proximity to TSSs. (A) Methylation levels at individual B1 loci (y-axis) are plotted against their distances to the nearest TSS (x-axis). Results for spermatogonia, spermatozoa, and liver are shown. Results for pachytene spermatocytes and round spermatids were nearly the same as those for spermatozoa (see Fig. 1C). (B) Methylation levels at B1 loci (B1_201–B1_216) that are present at <1 kb from TSS are shown on a grayscale as in Figure 1C. TSS-proximal B1 loci in the initial group (B1_060, B1_019, B1_046, B1_028, B1_052, and B1_059) are also included. (C) Statistics for B1 methylation and their distances from TSS. The 78 B1 loci (62 + 16) are categorized into those at ≤1 kb from TSS (upper pie charts) and those at >1 kb (lower pie charts). The loci are further categorized into 0%–19% methylation (white), 20%–79% methylation (gray), and 80%–100% methylation (black). The P-values from χ2 tests are shown at the bottom.


