
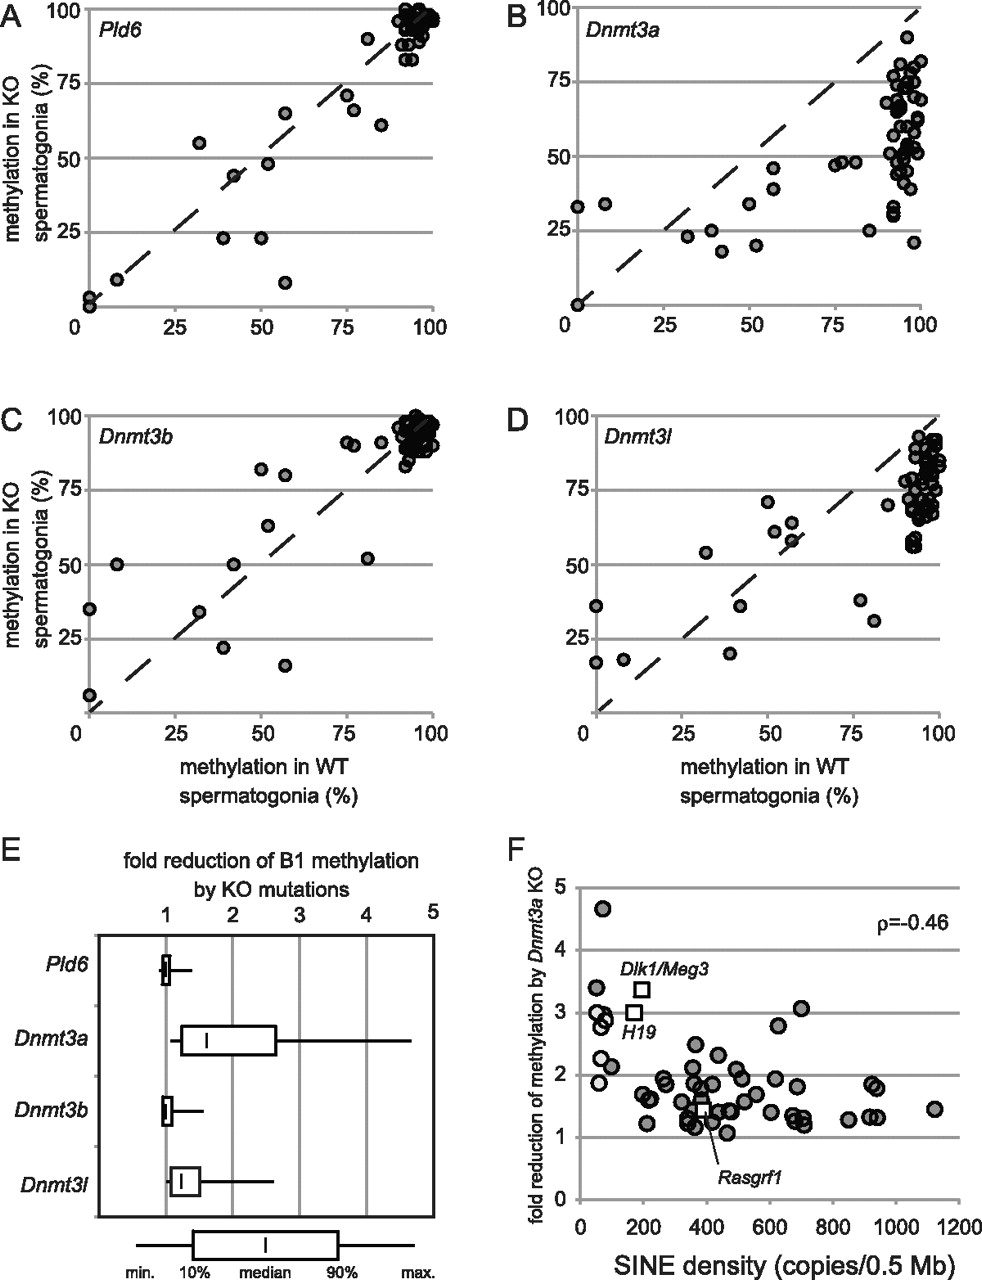
Effects of mutations in piRNA biogenesis and DNA methyltransferases on de novo B1 methylation. Methylation levels (y-axis) at individual B1 loci in spermatogonia of Pld6−/− (A), Dnmt3a2lox/1lox TNAP-Cre (B), Dnmt3b2lox/1lox TNAP-Cre (C), and Dnmt3l−/− (D) are plotted against their methylation levels in wild-type spermatogonia (x-axis). Dashed lines show the y = x slope. (E) Fold reductions in individual B1 methylation due to mutations. Only the data for B1 loci with ≥80% methylation in wild-type spermatogonia are included. (F) Fold reductions in methylation due to Dnmt3a KO mutation at individual B1 loci (dark gray circles) are plotted against the SINE density in the flanking genomic regions (0.25 Mb of each side). B1 loci selected from SINE-poor domains (B1_101–B1_105) are shown as light gray circles. The methylation levels at three paternally methylated regions for genomic imprinting (H19, Dlk1/Meg3, and Rasgrf1) in wild-type and Dnmt3a KO spermatogonia were examined as described previously (Kato et al. 2007), and the results are shown as open squares. Spearman's correlation coefficient (ρ) is shown on the right.


