
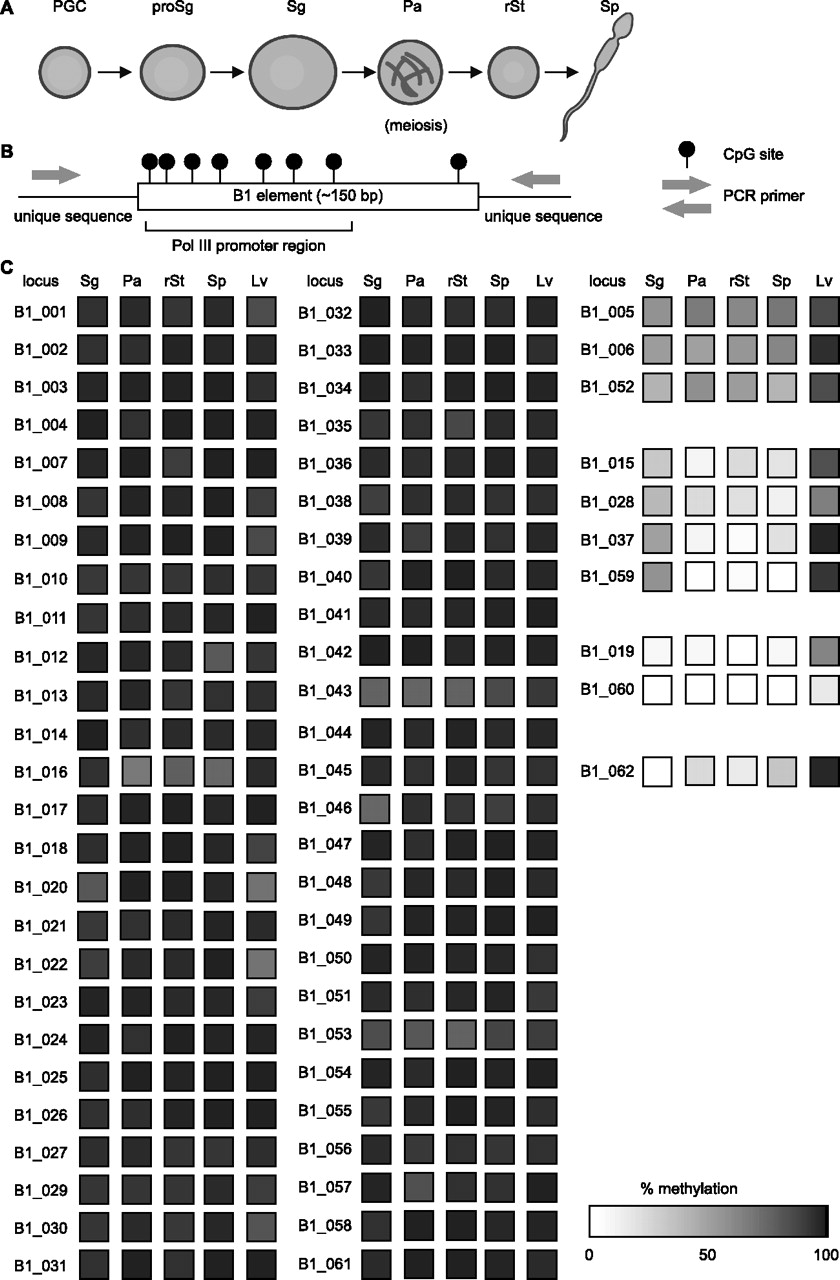
DNA methylation at B1 loci in germ and somatic cells. (A) Schematic representation of male germ cell development. (PGC) Primordial germ cell; (proSg) prospermatogonium; (Sg) spermatogonium; (Pa) pachytene spermatocyte; (rSt) round spermatid; (Sp) spermatozoon. (B) Experimental protocol for analysis of individual B1 elements. B1 elements (open rectangle) containing six to eight CpG sites (shown as lollipops) were selected, and primers (gray arrows) were designed for unique flanking regions. (C) Methylation of individual B1 elements. Methylation levels in the indicated cells (noted above the columns) at B1 loci designated on the left (B1_00–B1_062) are represented as filled squares on the basis of a grayscale: from white = 0% methylation to black = 100% methylation. (Lv) Liver cells.


