
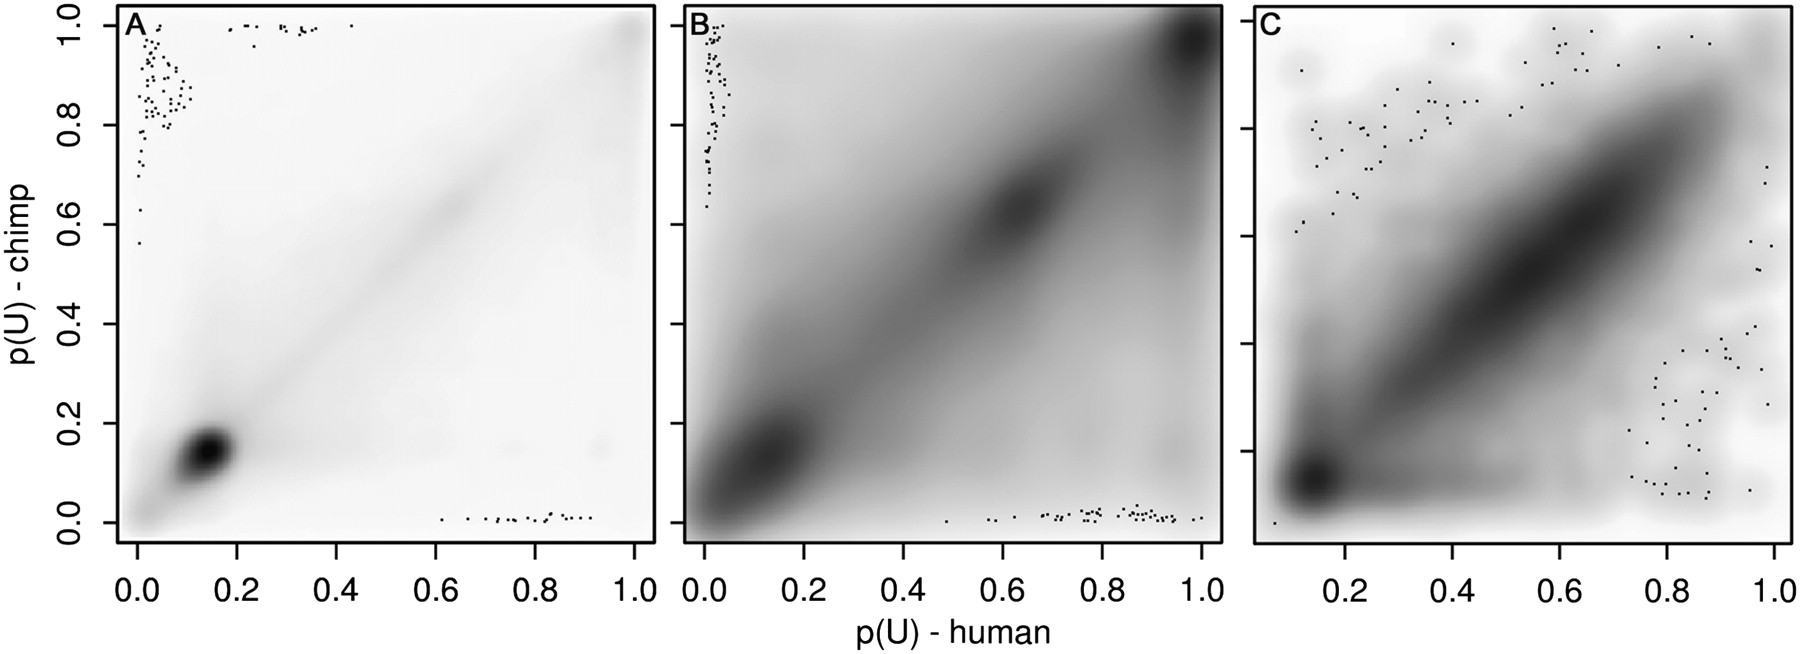
Comparison of the human and chimp neutrophil methylomes. Methylation probabilities p(U) are plotted, with human on the x-axis and chimp on the y-axis. Low p(U) indicates that a site is likely to be methylated, high p(U) indicates that a site is likely to be unmethylated. Individual sites are plotted; grayscale intensity is proportional to the number of sites at each position. Sites deviating from the diagonal have differential methylation in the two species. (A) Methylation probabilities for 606,496 orthologous human and chimp HpaII sites outside 14,316 orthologous human and chimp SUMIs. The sites are highly correlated (r2 = 0.74, P < 10−3 by permutation analysis) indicating conservation of methylation states between the species. (B) Methylation probabilities for 122,878 orthologous human and chimp HpaII sites within the 14,316 orthologous SUMIs. The sites are less correlated than sites outside SUMIs (r2 = 0.61, P < 10−3). (C) Mean methylation probabilities of the 14,316 orthologous human and chimp SUMIs (r2 = 0.65, P < 10−3). The distribution of methylation probabilities along the diagonal appears to be bimodal, with a cluster at p(U) < 0.2 and a cluster at 0.3 < p(U) < 0.9; 15% of HpaII sites within SUMIs are methylated in at least one species.


