
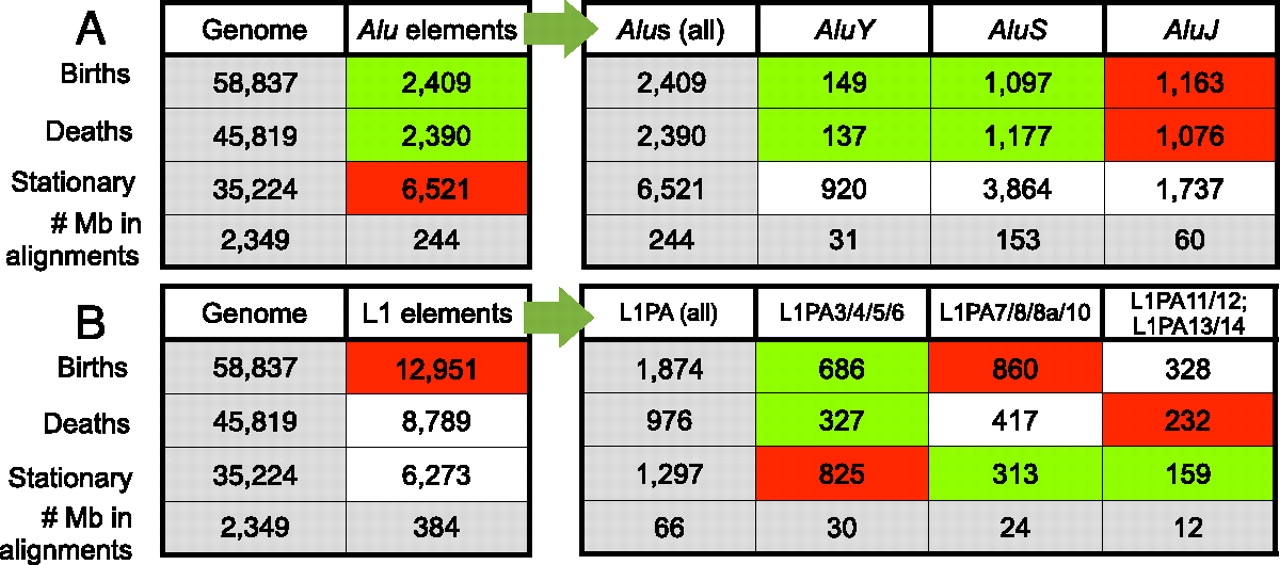
Figure 4.
Number of microsatellite births, deaths, and stationary loci mapping to (A) all Alus and different Alu subfamilies, and (B) all L1s and different L1PA subfamilies (thresholds [9,5,4,3]). Gray cells were used to derive expected counts in χ2 tests for over- or under-representation of birth/death/stationary loci in all Alus and L1s (left panels), and in different Alu and L1 subfamilies (right panels). Loci corresponding to green and red colored cells have, respectively, significant under- and over-representation (P-values provided in Supplemental Fig. S10).


