
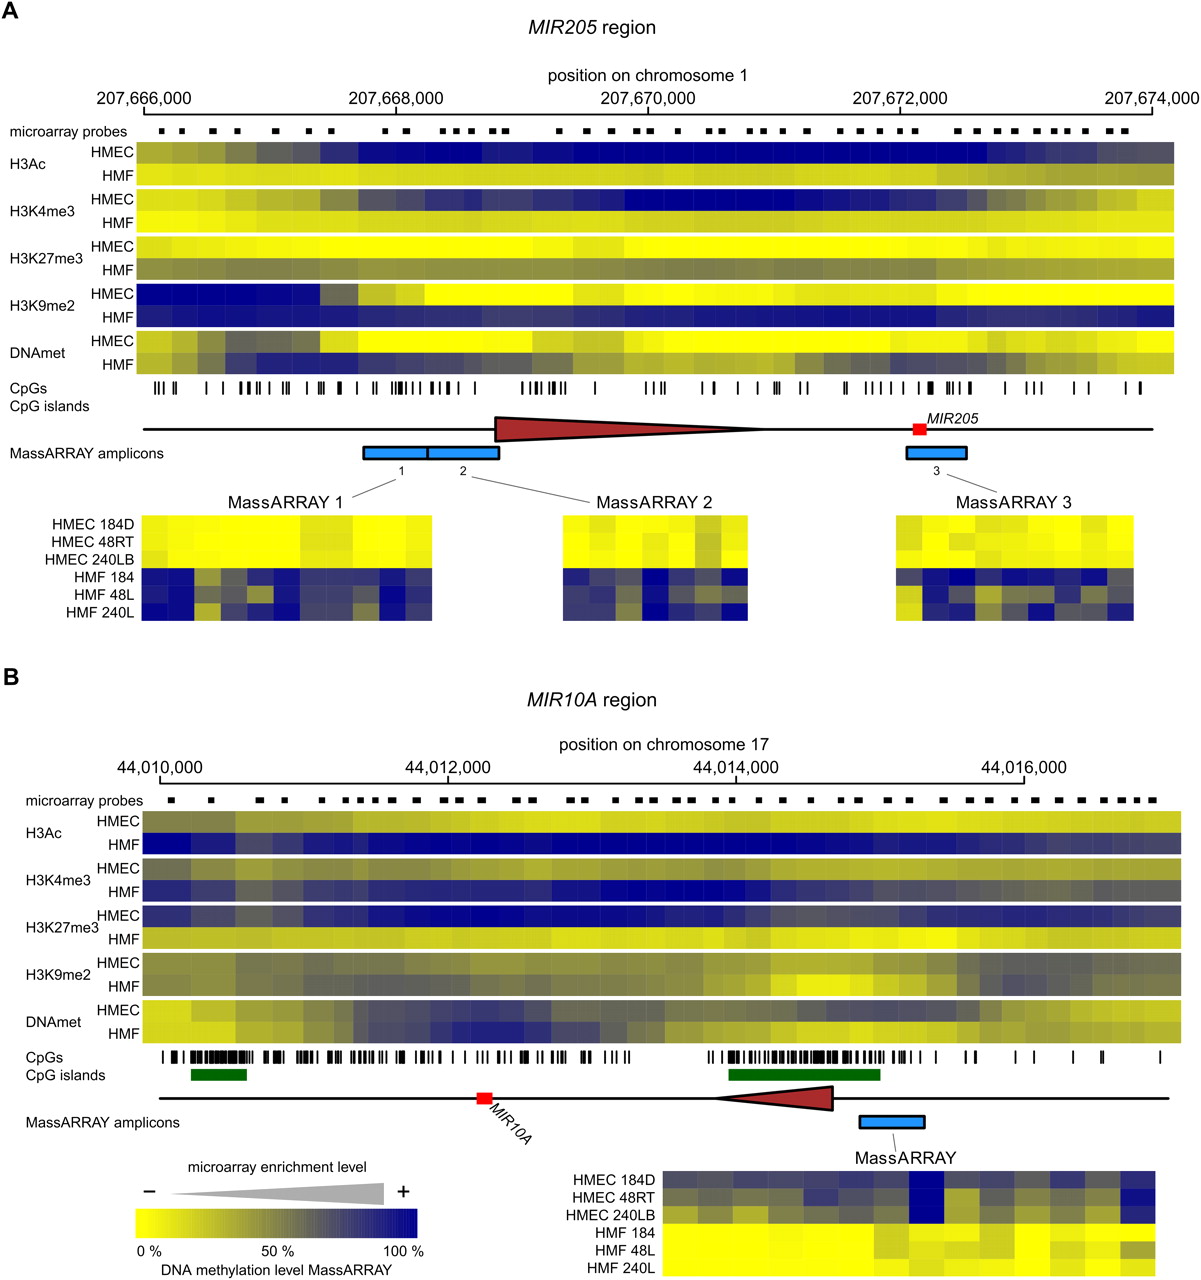
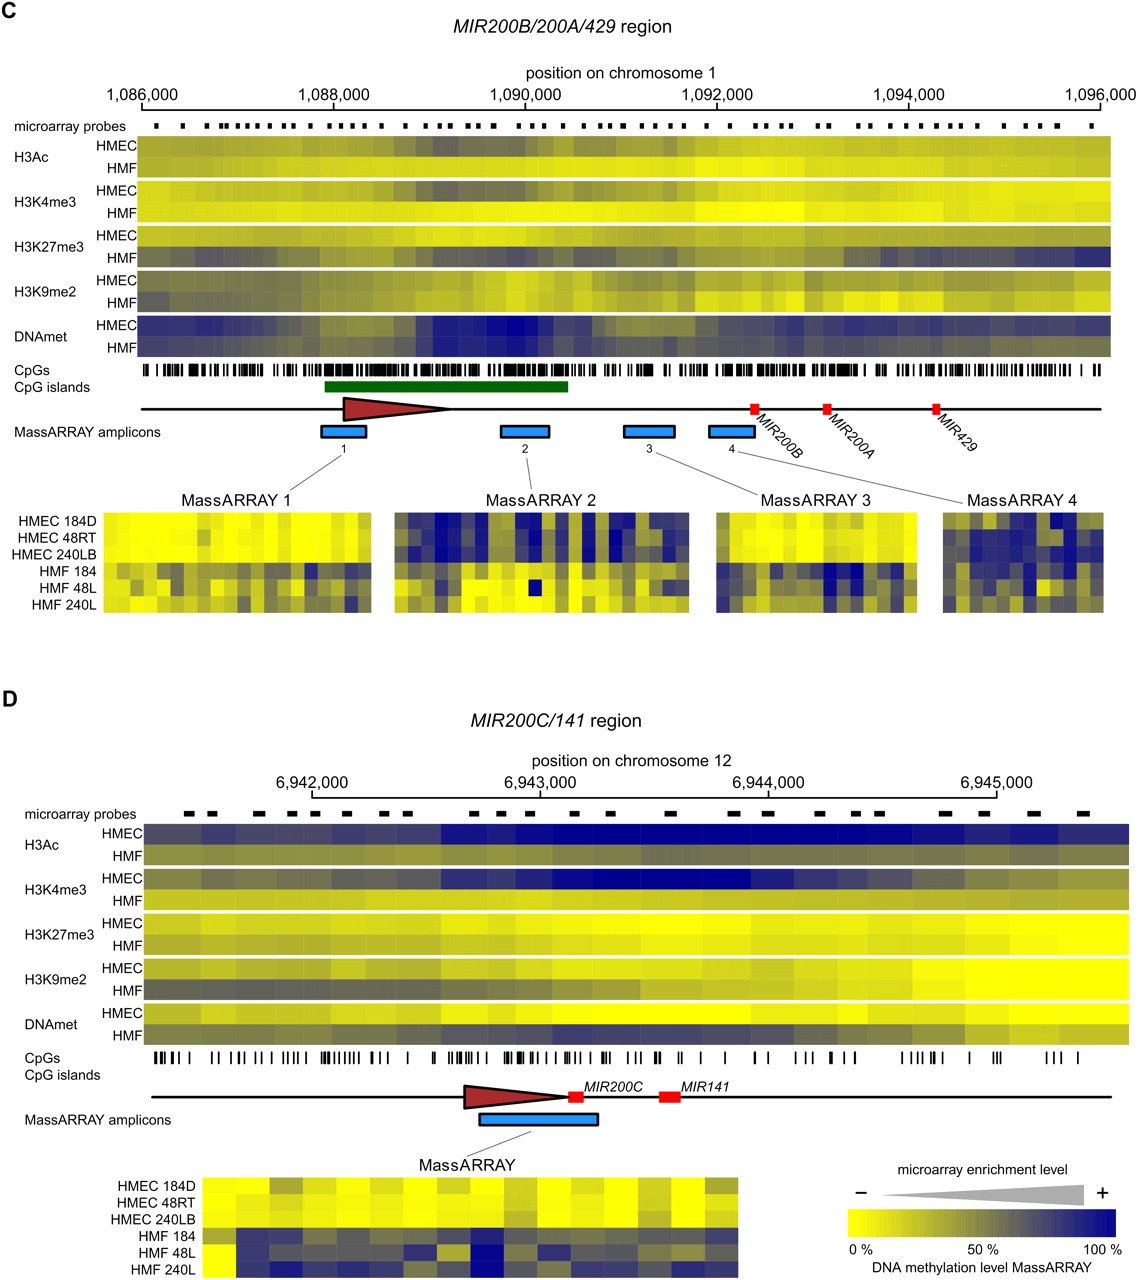
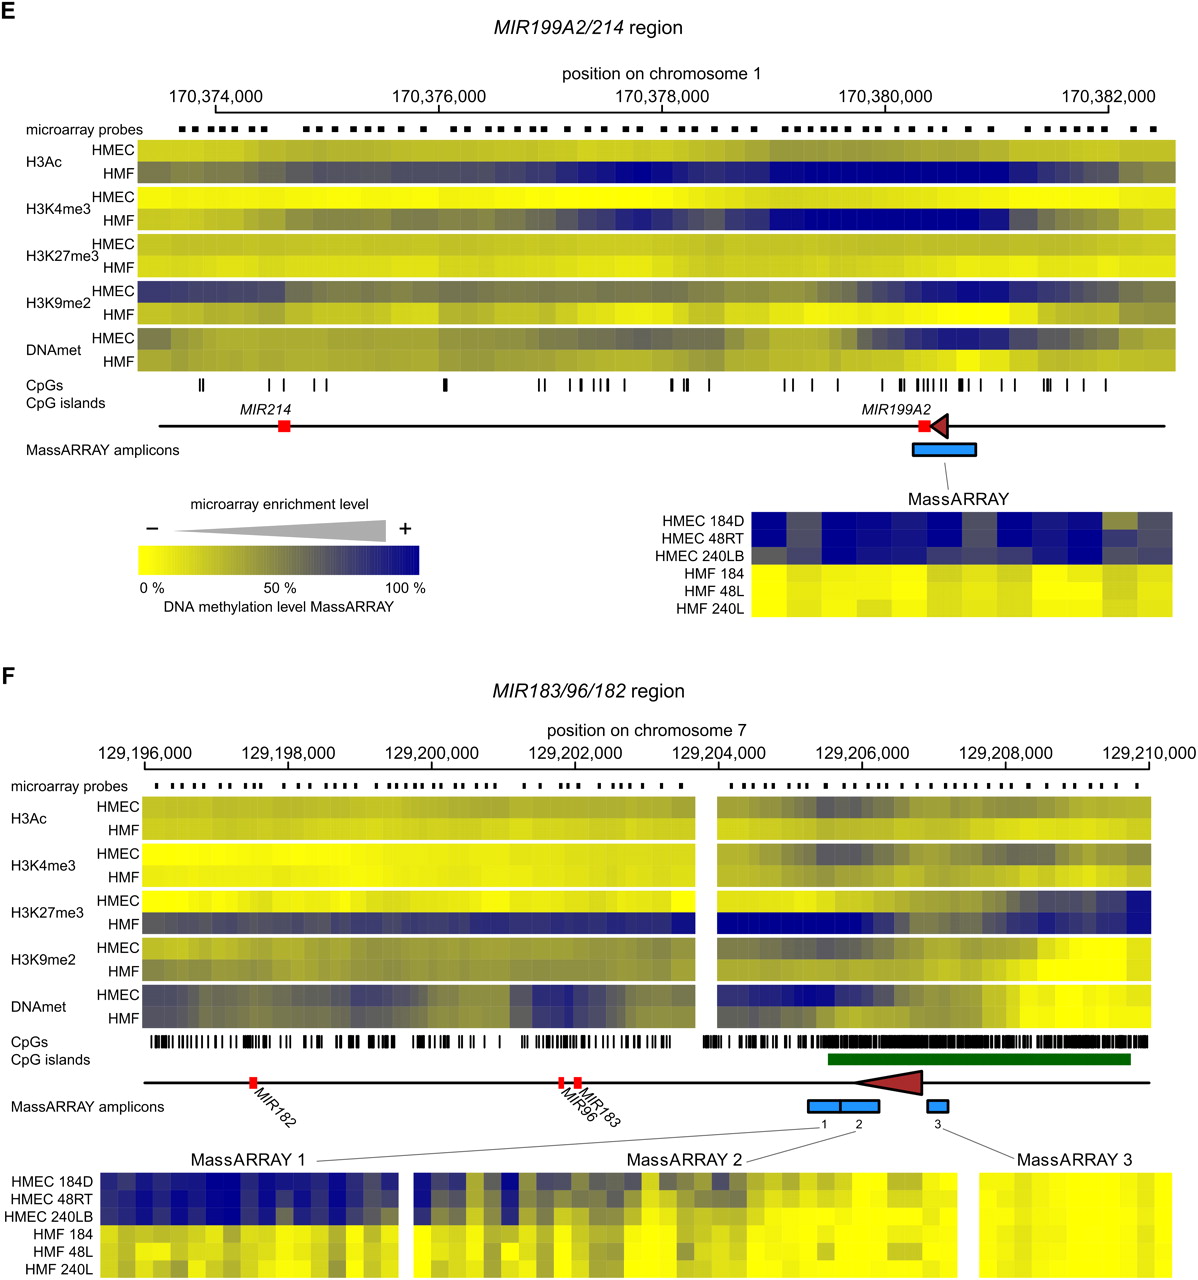
The epigenetic state of cell type–specific miRNA genes in HMEC and HMF. Panels A–F show data for MIR205, MIR10A, MIR200B/200A/429, MIR200C/141, MIR199A2/214, and MIR183/96/182 miRNA genes, respectively. (Top part of each panel) The enrichment of individual epigenetic marks through the regions in a heatmap form, with yellow indicating no enrichment and blue color indicating high enrichment. The data for HMEC and HMF samples are averages from three genotypes of HMEC and HMF, respectively. The chromosomal positions are according to the hg18 human genome assembly. The miRNA hairpin coding regions are displayed as red rectangles and predicted transcription start site regions as brown triangles. Small black rectangles at the top lane indicate positions of individual microarray probes. The tics at the bottom indicate positions of individual CpG dinucleotides. CpG islands according to UCSC are displayed as green rectangles when present. The blue rectangles at the bottom lane indicate positions of regions analyzed for DNA methylation by MassARRAY technology. Results from MassARRAY for individual regions indicated are shown at the bottom part of each panel. The level of methylation of individual CpG units within the MassARRAY amplicon is displayed as a heatmap with the lowest methylation (0%) in yellow and the highest methylation (100%) in blue. The individual samples are labeled on the left.


