
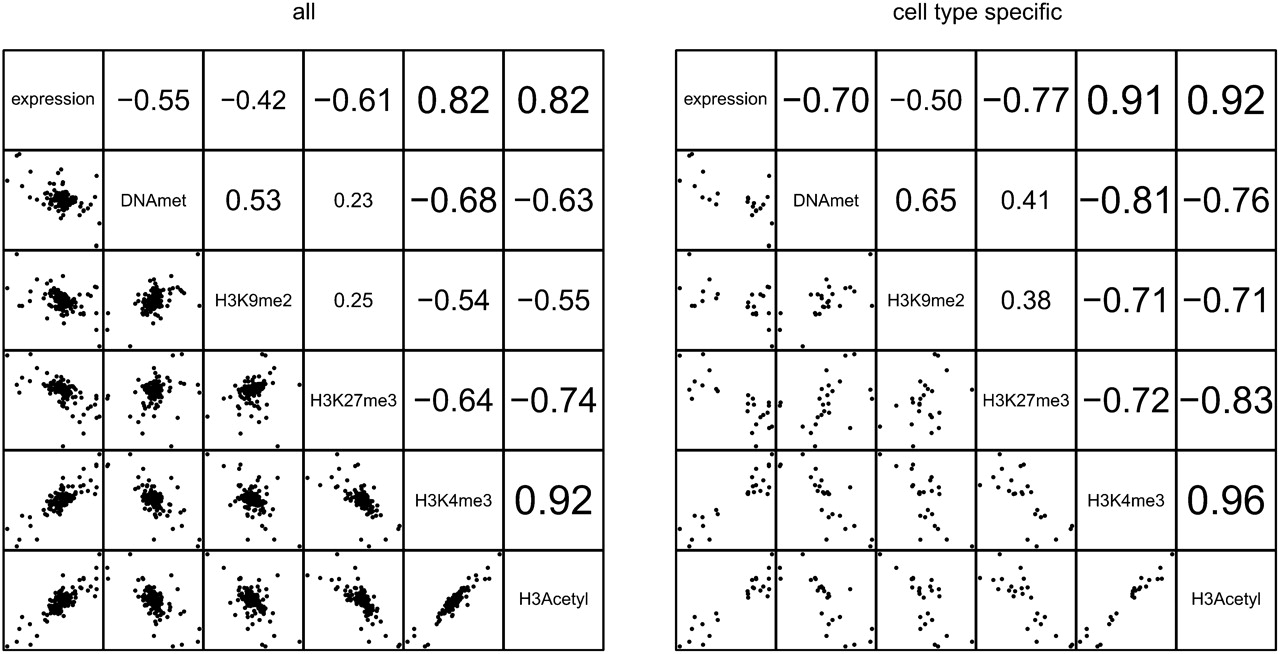
Figure 3.
Differences in HMEC/HMF miRNA expression correlated with differences in epigenetic marks at their promoters. We used data from all probes within a 2-kb region centered on the predicted TSS region, and calculated the correlation of difference in enrichment of individual epigenetic marks between the cell types. (Left) Correlations for all 169 miRNA genes and gene clusters, where the promoter was predicted; (right) 24 cell type–specific miRNA genes only. The numbers show correlation coefficients for individual pairs of epigenetic marks.


