
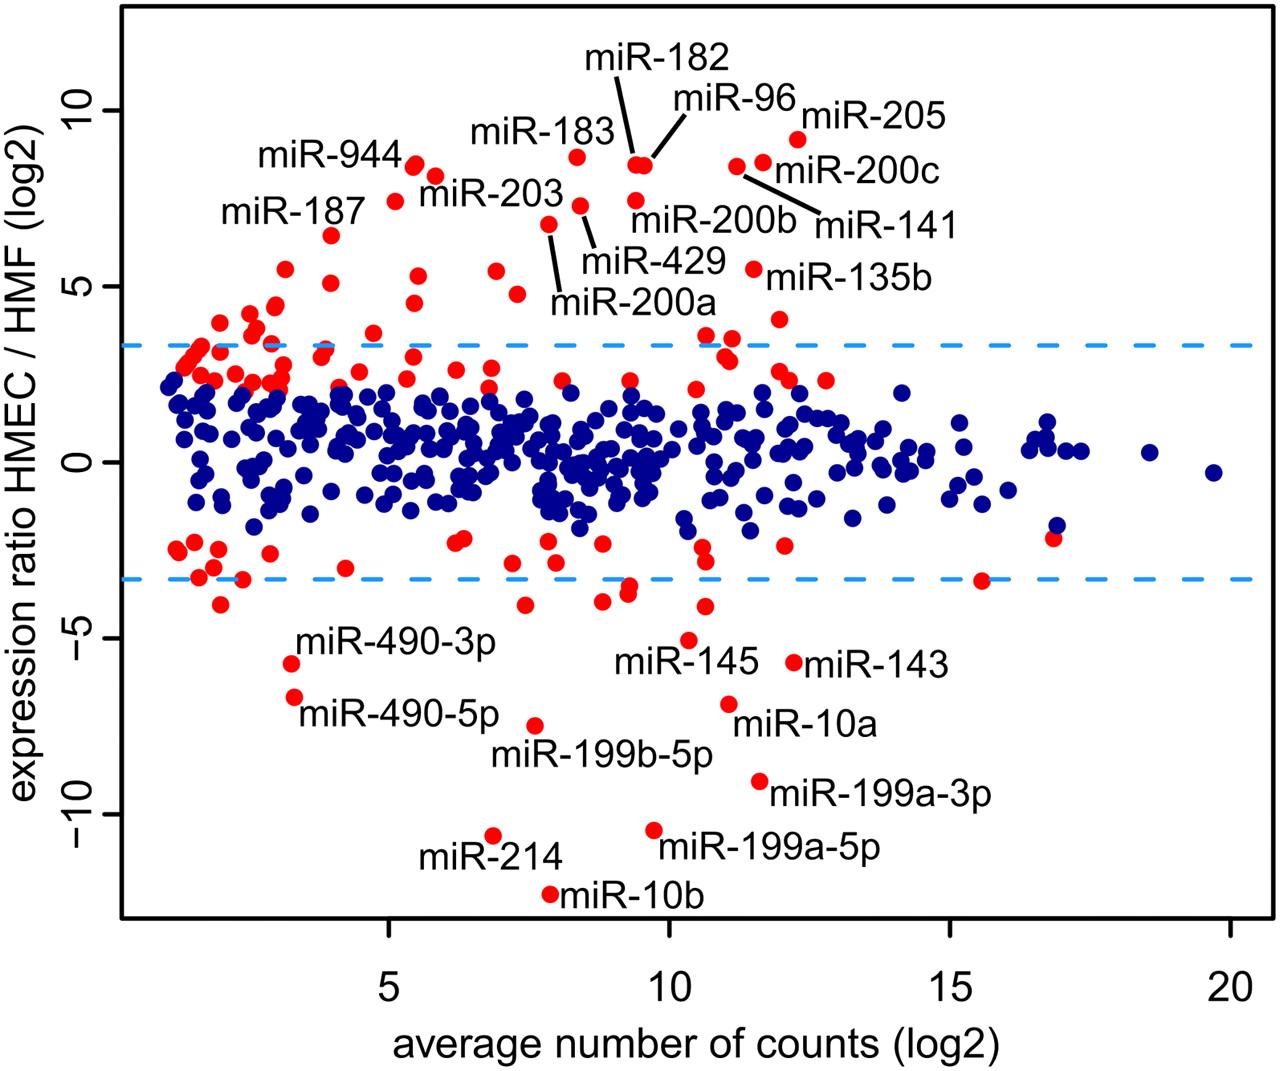
Figure 1.
Differential miRNA expression between HMEC and HMF obtained from three independent pairs of samples. The y-axis displays the HMEC to HMF expression ratio, the x-axis displays the average expression of miRNAs; both axes are in logarithmic scale. (Red) Differentially expressed miRNAs (at least fourfold difference in expression, P-value ≤0.05). (Blue dashed horizontal lines) Tenfold differences in expression. Several cell type–specific miRNAs are marked.


