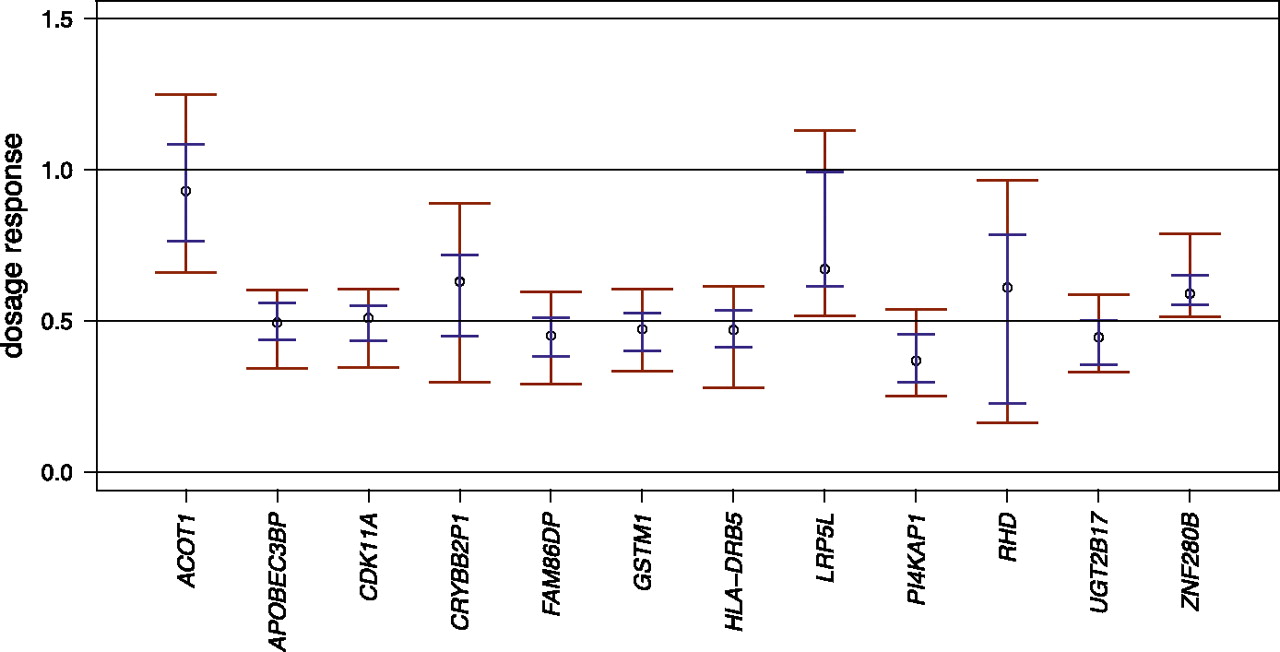
Figure 6.
Evaluation of dosage compensation in gene deletion loci. The figure displays relative normalized expression values of samples with copy number (CN) = 1 relative to samples with CN = 2. The circles mark the ratio between the median expressions of samples with CN = 1 and samples with CN = 2. The error bars indicate bootstrap confidence intervals for 68% (short blue horizontal lines) and 95% (long red horizontal lines).


