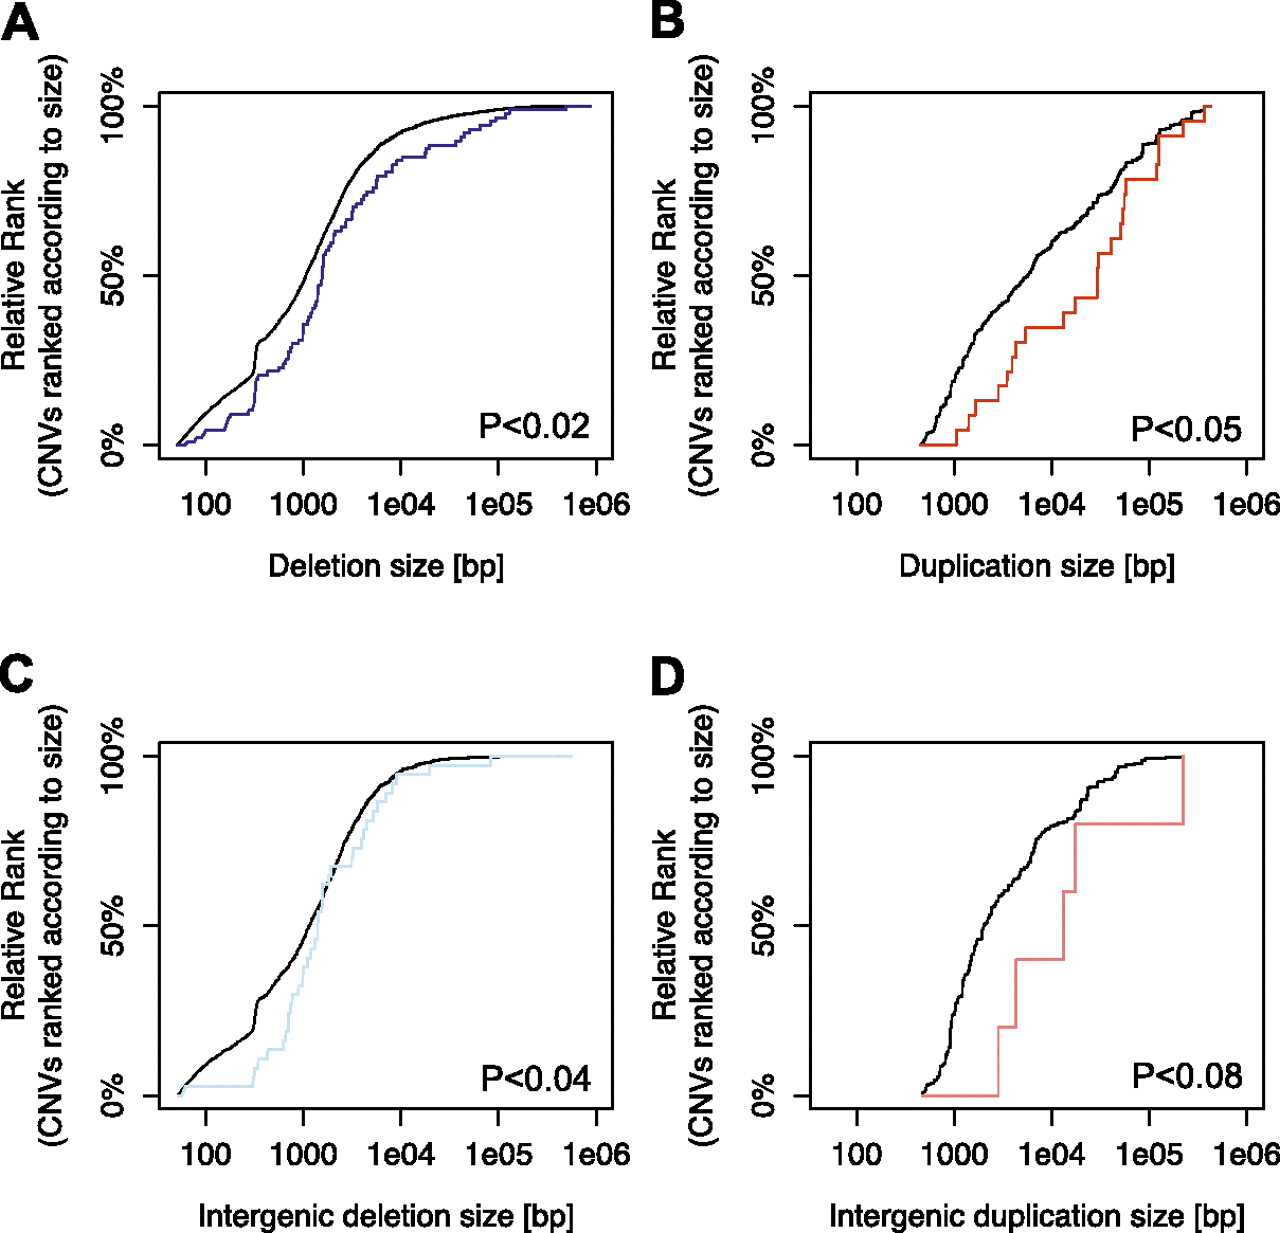
Enrichment of large deletions and duplications among CNV-associated eQTLs. (A) Enrichment of large deletions among expression-associated variants. (Blue line) Cumulative distribution functions of the size of expression-associated deletions. (Gray line) The size distribution of the entire list of deletions in the search range of our survey. The distribution is adjusted for the fact that large variants have a higher chance to be within the search range of a gene than small variants, by considering each variant as many times as there are expressed genes in its search range. The P-values shown are based on Kolmogorov-Smirnov (KS) tests. (B) Significant enrichment of large duplications (red line) among expression-associated variants. (Gray line) The size distribution of duplications considered in our survey. (C) Significant enrichment of large intergenic deletions (light blue line) among expression-associated variants. (Gray line) The size distribution of intergenic deletions considered in our survey. (D) Marginally significant enrichment of large intergenic duplications (light red line) among expression-associated variants. (Gray line) The size distribution of intergenic duplications considered in our survey.


