
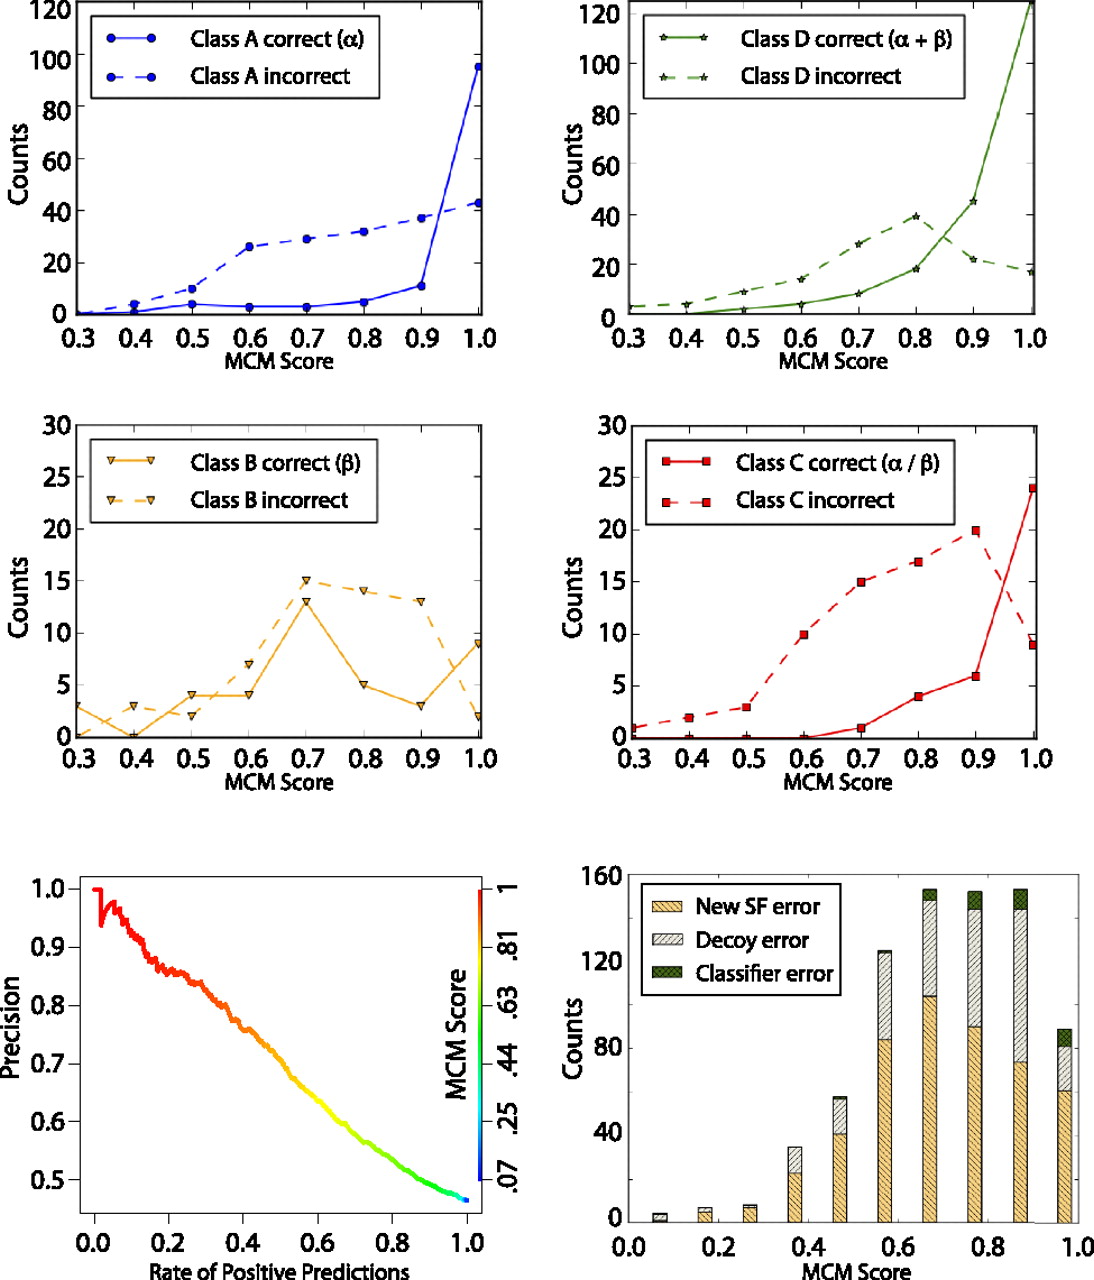
Distribution of SCOP superfamily classifications. (Top and middle) A set of 875 protein domains (SAP set) folded by Rosetta and whose structure (or protein with strong sequence similarity) has been solved after our prediction was used to determine the accuracy of our method's ability to correctly classify SCOP superfamilies. Plotted in solid lines and dotted lines are the number of correct and incorrect classifications, respectively. Classifications are broken down by SCOP class A (α; blue), B (β; yellow), C (β–α–β; red), and D (segregated α and β; green). This graph demonstrates that classifications with high MCM scores are the most accurate in classifying the SCOP superfamily. (Bottom left) The precision/yield plot shows the percentage of protein domains in the SAP set classified using SCOP v1.75 for varying precisions. The line is colored relative to MCM score (right axis). (Bottom right) The histogram of superfamily classification error types represents the total number of incorrectly classified models in the SAP set for different MCM score ranges using a previous version of SCOP (v1.67). “New SF error” is the error due to a new superfamily (i.e., the true superfamily was not represented in the structure comparison set), 62% of total error. “Decoy error” is the error due to insufficient de novo model quality, 28% of total error. “Classifier error” is the error due to the superfamily classifier being inaccurate, 10% of total error.


