
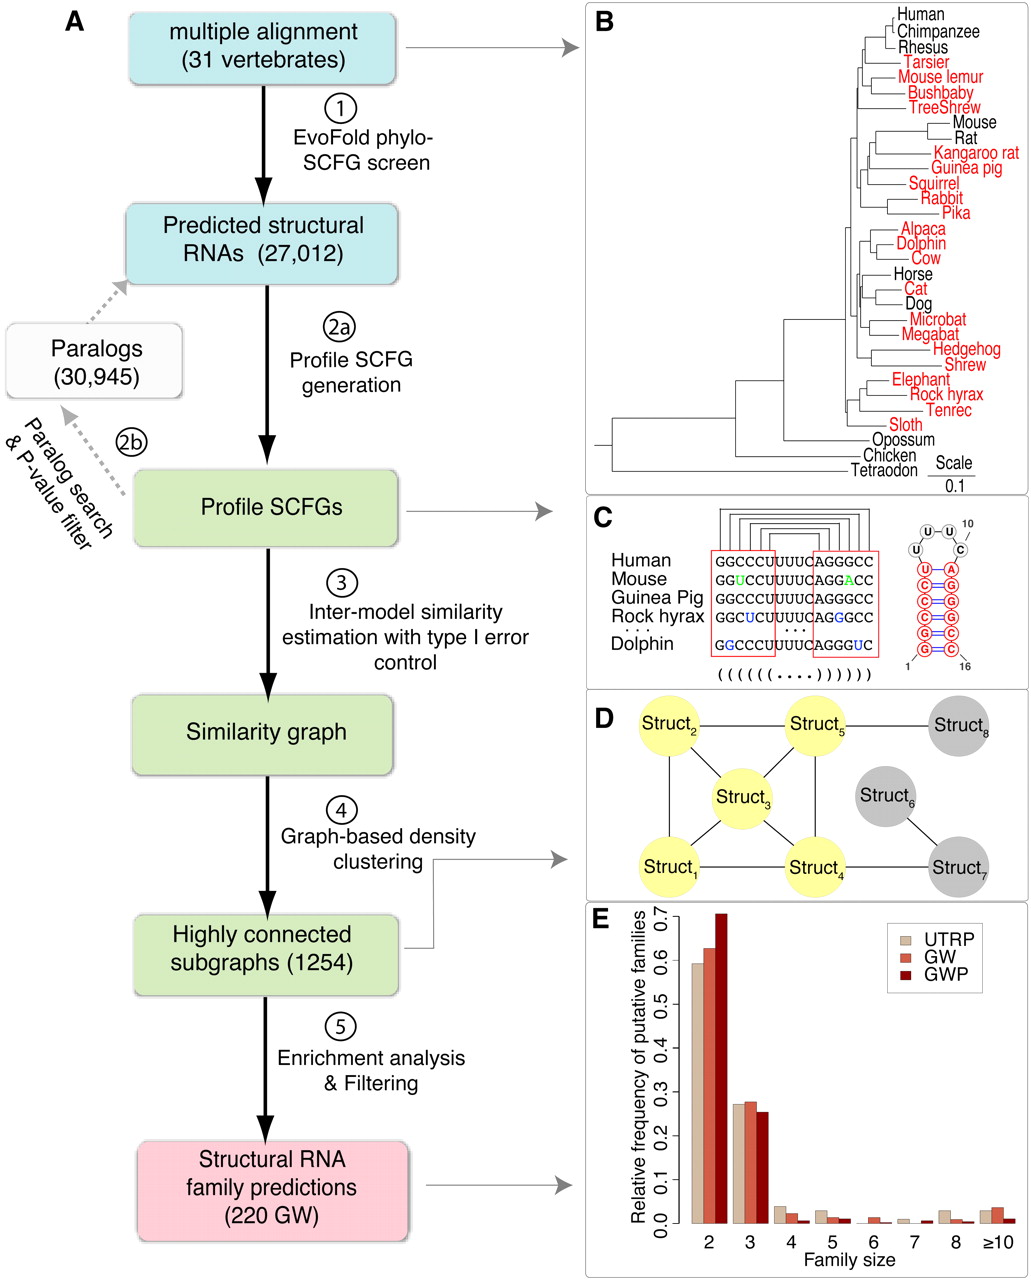
Figure 1.
EvoFam family identification pipeline. (A) Overview of EvoFam analysis and data flow. (B) Phylogenetic tree relating the 31 species of the alignment screened by EvoFold. (C) Each structure prediction is converted into a profile SCFG model. These models describe the nucleotide (or di-nucleotide) distributions at every base and base pair in the structure. (D) Small example of similarity graph between profile models. Maximal highly connected subgraphs (yellow) are extracted as putative families. (E) Distribution of family sizes in the three final prediction sets.


