
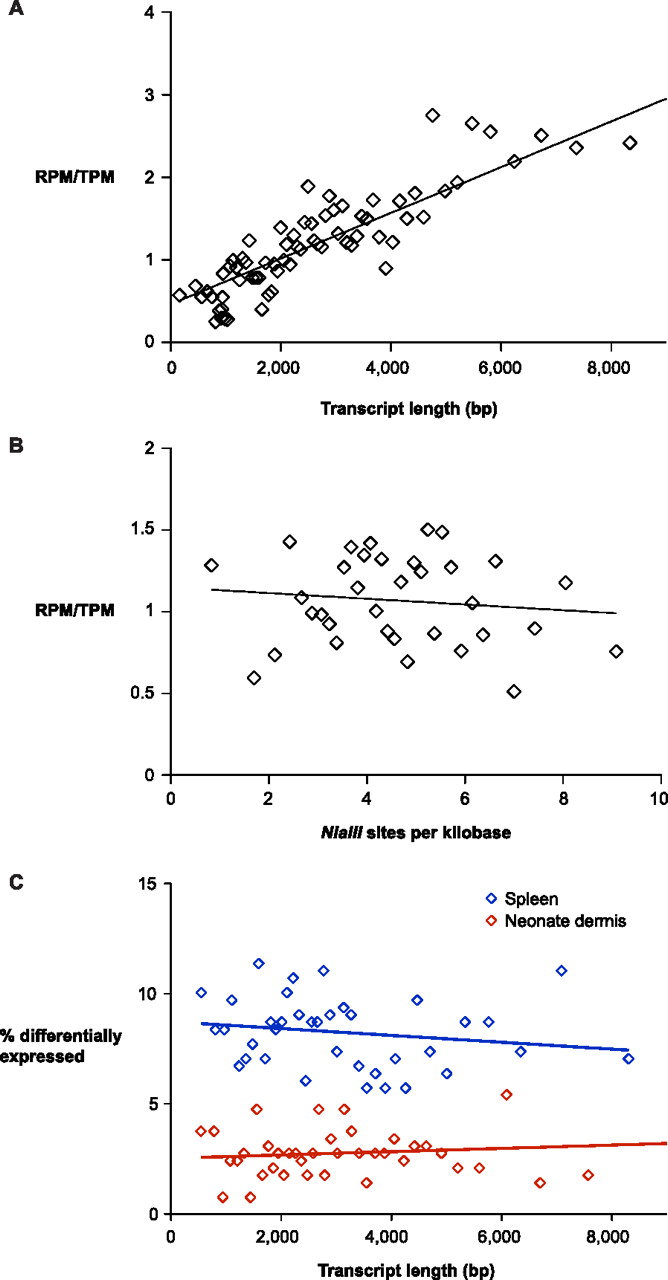
Systematic biases in RNA-seq and EDGE. The relative frequency of RNA-seq reads and EDGE tags is dependent on transcript length (A) and independent of NlaIII site frequency within transcripts (B). RefSeq genes were sorted by transcript length (A) and frequency of NlaIII sites (B) and placed into bins of 300 genes and 500 genes, respectively. The relative ratio of reads per million exonic RNA-seq reads (RPM) and tags per million exonic EDGE tags (TPM) within each bin is plotted (diamonds). Linear regression lines are plotted for each graph and show a significant correlation in RPM/TPM ratio with transcript length (p < 1×10⁻⁴) and an insignificant relationship in RPM/TPM ratio with NlaIII site frequency (p = 0.51). (C) The ability of EDGE to detect differential gene expression is not dependent on transcript length. Genes that were detected by EDGE were sorted by transcript length and placed into bins of 300 genes. The percentage of differentially expressed genes within each bin is plotted (diamonds). Linear regression lines are plotted for neonate dermis (p = 0.68) and spleen (p = 0.29).


