
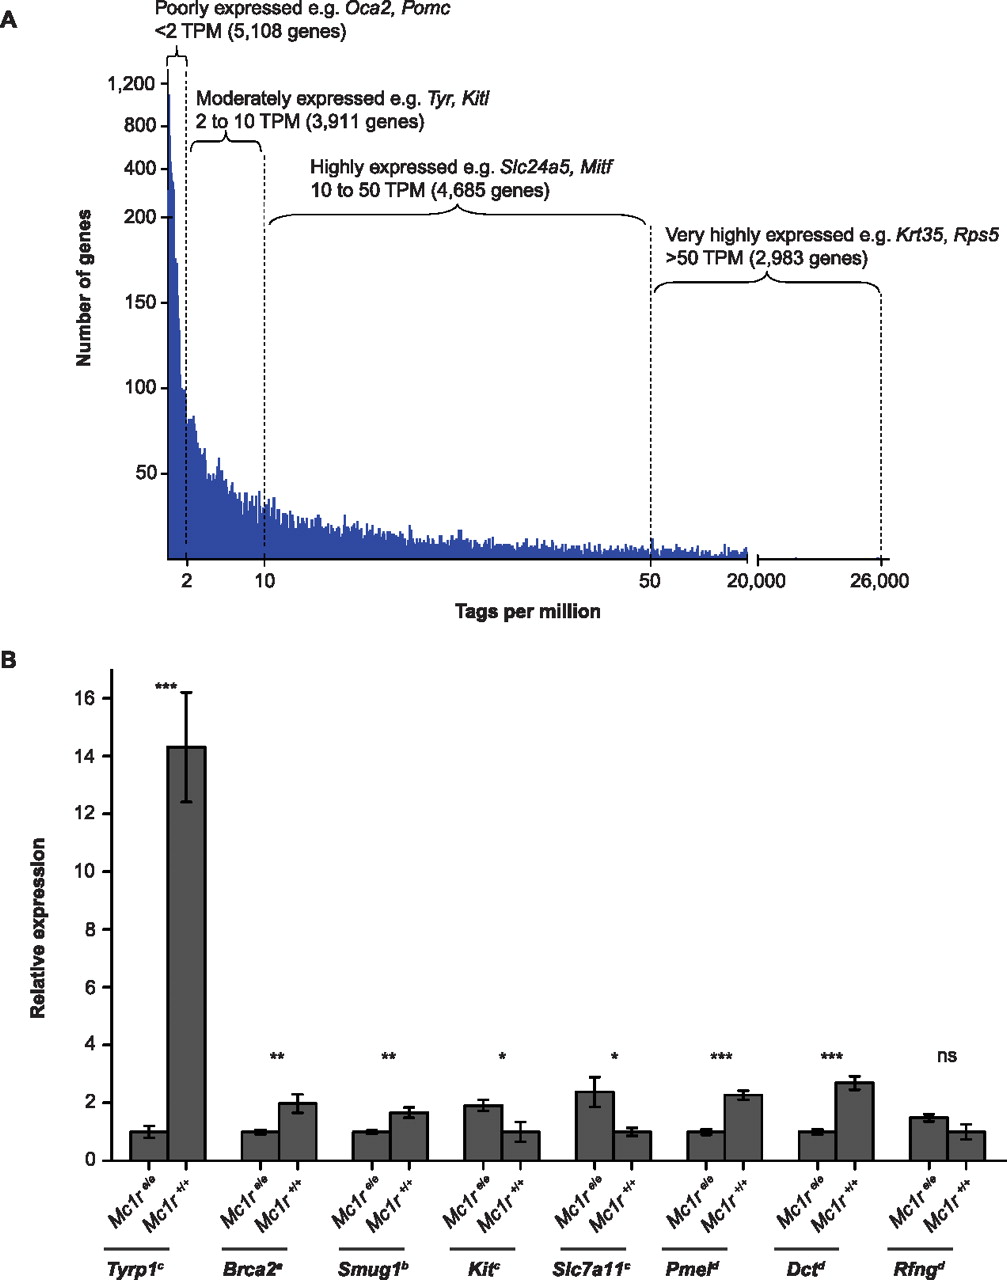
Figure 2.
(A) Dynamic range of gene expression detected by EDGE. The TPM distribution (x-axis) for genes detected by EDGE is plotted against number of genes (y-axis) and identifies poorly expressed genes below 2 TPM, moderately expressed genes with 2 to 10 TPM, highly expressed genes with 10 to 50 TPM, and very highly expressed genes above 50 TPM. (B) Seven out of eight differentially expressed genes from EDGE showed significant differences when transcript abundance was measured by quantitative RT-PCR. Brca2: <2 TPM; Smug1: 2 to 10 TPM; Tyrp1, Kit, Slc7a11: 10 to 50 TPM; Pmel, Dct, Rfng: >50 TPM in EDGE libraries. (*) p < 0.05; (**) p < 0.001; (***) p < 0.0001; (ns) not significant.


