
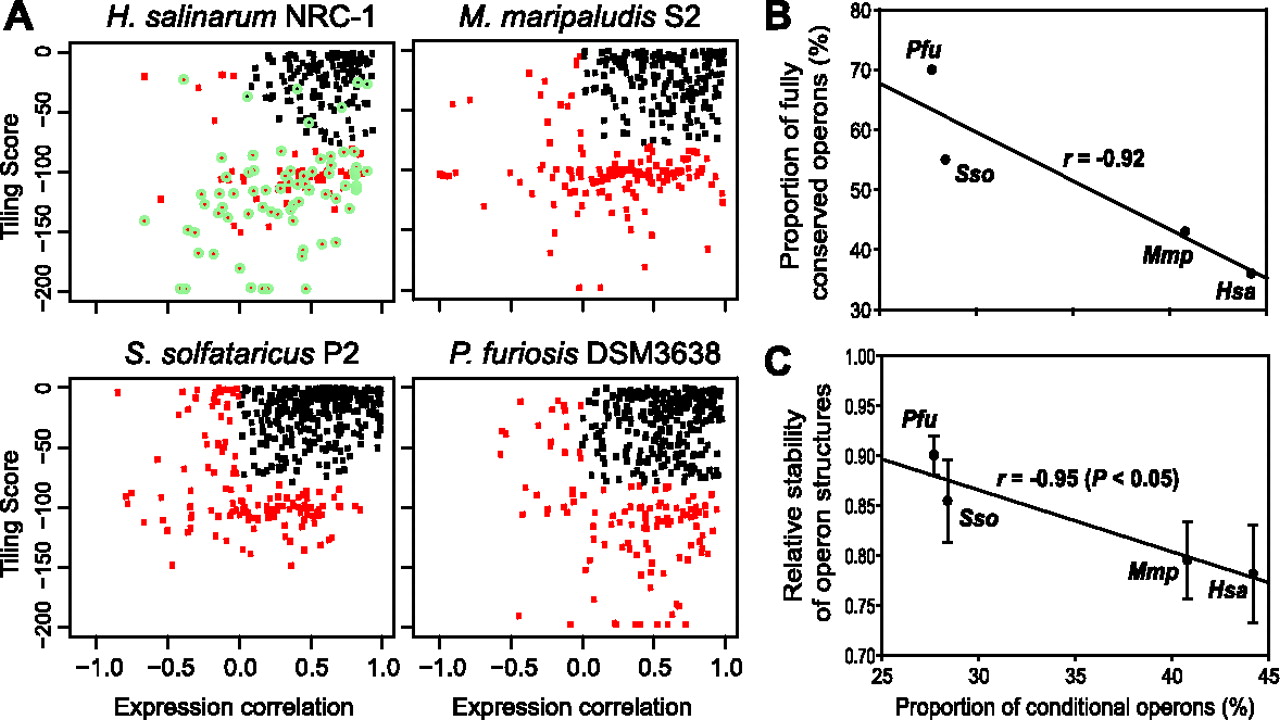
Conditional operons. (A) Conditional operons were discovered by integrating two scores: tiling score and expression correlation. “Tiling score” indicates uniformity of raw signal intensity of probes tiled across the entire operon; “expression correlation” was calculated from expression data from studies that probed responses of these organisms to a diverse set of environmental perturbations. Conditional operons in this bivariate “conditional operon plot” were identified previously in Hsa by extensive manual inspection (green circles) and used to train a classification model which separated conditional operons (red points) from canonical operons (black dots) (Koide et al. 2009). Our classifier accurately identified nearly all manually curated operons with conditional behavior. We have used the same classification criteria previously learned on Hsa to discover conditional operons in Mmp, Sso, and Pfu. (B) Plot of proportion of conditional operons versus proportion of fully conserved operons. (C) Plot of proportion of conditional operons versus proportion of relative stability of operons of each organism. Relative stability of operon was estimated using a previously published method (Itoh et al. 1999). Briefly, under the assumption of independent destruction of operon structures, comparison of operon structures in genome 1 with those of genomes 2 and 3 led to calculation of relative stabilities of operons in strain 2 and 3. Error bars represent the standard error in six values from multiple comparisons.


