
Abstract
Assembly of genes into operons is generally viewed as an important process during the continual adaptation of microbes to changing environmental challenges. However, the genome reorganization events that drive this process are also the roots of instability for existing operons. We have determined that there exists a statistically significant trend that correlates the proportion of genes encoded in operons in archaea to their phylogenetic lineage. We have further characterized how microbes deal with operon instability by mapping and comparing transcriptome architectures of four phylogenetically diverse extremophiles that span the range of operon stabilities observed across archaeal lineages: a photoheterotrophic halophile (Halobacterium salinarum NRC-1), a hydrogenotrophic methanogen (Methanococcus maripaludis S2), an acidophilic and aerobic thermophile (Sulfolobus solfataricus P2), and an anaerobic hyperthermophile (Pyrococcus furiosus DSM 3638). We demonstrate how the evolution of transcriptional elements (promoters and terminators) generates new operons, restores the coordinated regulation of translocated, inverted, and newly acquired genes, and introduces completely novel regulation for even some of the most conserved operonic genes such as those encoding subunits of the ribosome. The inverse correlation (r = –0.92) between the proportion of operons with such internally located transcriptional elements and the fraction of conserved operons in each of the four archaea reveals an unprecedented view into varying stages of operon evolution. Importantly, our integrated analysis has revealed that organisms adapted to higher growth temperatures have lower tolerance for genome reorganization events that disrupt operon structures.
Virtually all microorganisms in natural habitats undergo constant reorganization of their genomes via activity of insertion sequence (IS) elements, large-scale indels, gene displacements, and horizontal gene transfer (HGT) events as they continually adapt to their environmental niche (Koonin and Wolf 2008; Rocha 2008). This process shapes prokaryotic genomes into operational units by re-organizing genes into operons (“operonization”) (Rocha 2008), as the resulting cotranscription and cotranslation of genes is believed to give these organisms a competitive edge (Price et al. 2006; Bratlie et al. 2010; Sneppen et al. 2010). Experimental evolution studies combined with genome resequencing have correlated specific mutations to phenotypic changes to demonstrate that these dynamic genome reorganizational events are tightly coupled to adaptive evolution (Herring et al. 2006; Barrick et al. 2009). Interestingly, several studies have reported that, along with metabolic and structural genes, mutations within regulatory genes are also adaptive (Harris et al. 2009; Wang et al. 2010), which suggests that altering gene regulatory programs is an effective strategy for adaptation over short time intervals. Despite benefits of efficient coordinate regulation due to operonization, there is a surprisingly low level of conservation in operon structures across organisms. This is because genes within operons are also extensively rearranged or disrupted during evolution due to genome shuffling events that are functionally neutral (Itoh et al. 1999).
Although gene reorganization and changes in cis-regulatory regions are major mechanisms for generating phenotypic diversity (Wray 2007; Stern and Orgogozo 2008), most studies that investigate evolutionary processes almost exclusively focus on protein-coding mutations. This is because mutations within coding regions (e.g., nonsynonymous substitutions, frameshifts, and premature stop codons) provide direct functional insight into the altered protein structures. However, it is not entirely straightforward to predict the consequences of gene reorganization or cis-regulatory mutations on changes in gene expression (Wray 2007; Stern and Orgogozo 2008). Thus, functional consequences of regulatory changes can only be accessed experimentally through analysis of gene expression patterns or transcriptome architecture (TA) using microarray- and sequencing-based technologies.
In recent years, measurements of TAs of bacteria (Cho et al. 2009; Guell et al. 2009; Perkins et al. 2009; Toledo-Arana et al. 2009) and archaea (Jager et al. 2009; Koide et al. 2009; Wurtzel et al. 2010) have expanded our understanding of transcriptional regulatory mechanisms through discovery of features that are not immediately evident from simple genome analysis, including antisense RNAs, widespread overlapping 5′ and 3′ untranslated regions (UTRs), and prevalent distribution of transcription starts and stops inside operons and coding sequences (Croucher and Thomson 2010; Sorek and Cossart 2010). Importantly, it is now clear that multiple transcriptional units can be generated from the same set of genes in diverse environmental conditions. Such context-dependent modulation of over 40% of all operons (Guell et al. 2009; Koide et al. 2009) raises important questions regarding formation and loss of operons (Price et al. 2006) and how this process is coupled to alterations in gene regulatory programs (Sorek and Cossart 2010).
Here, we report results of studies that were designed to probe the interplay of operonization on gene regulatory programs. In brief, we have analyzed 65 fully sequenced archaeal genomes to demonstrate that there exists a statistically significant trend that correlates stability of operon structures in an organism to its phylogenetic lineage. We have probed this phenomenon further by conducting comparative analysis of genome organizations and TAs of four phylogenetically diverse archaea—a hydrogenotrophic methanogen (Methanococcus maripaludis S2, referred to as Mmp hereafter), an anaerobic hyperthermophile (Pyrococcus furiosus DSM 3638, Pfu), an acidophilic and aerobic thermophile (Sulfolobus solfataricus P2, Sso), and a photoheterotrophic halophile (Halobacterium salinarum NRC-1, Hsa)—that span the spectrum of operon stability. In this comparative analysis we put special emphasis on the conditional activation of transcriptional elements within conserved operons; i.e., transcriptional promoters and terminators that are internal to operon structures and whose activity is observed in some but not all environments. For clarity, operons that have such internally located transcriptional elements will be referred to as “conditional operons,” as opposed to “canonical operons,” which produce a single polycistronic transcript, and operons that are conserved across two or more organisms as “conserved operons.” The integrated analysis of genome reorganization and TA in the context of these varied classes of operons has provided an unprecedented view into the process of operonization. We demonstrate that genomic reorganization is coupled to evolution of new transcriptional elements (promoters and terminators) to incorporate translocated, inverted, and newly acquired genes into the existing gene regulatory program. Remarkably, while in most cases these newly evolved transcriptional elements link regulation of functionally related genes, this process also results in evolution of completely new regulatory logic for even some of the most conserved operons, such as those encoding subunits of the ribosomes. Our discovery that organisms with a higher fraction of conserved operons also tend to have lower numbers of operons with conditionally activated internal transcriptional elements demonstrates how the evolution of TA works in parallel to genome reorganization to retain coordinate control of functionally linked genes during intermediate stages of operonization.
Results
Degree of operonization is distinct to each archaeal lineage
We begin our survey of genomic organization by estimating density of predicted operons (i.e., number of genes encoded in predicted operons [Price et al. 2005] divided by total number of genes) in 65 archaeal genomes. Although the proportion of genes that are organized into operons was variable across organisms, it was conserved within lineages (Fig. 1A,B; Supplemental Table S1). Density of operons was highest in euryarchaeotal methanogens (Methanobacteria, Methanococci, Methanomicrobia, and Methanopyri) (60% average, t-test P-value < 3 × 10⁻¹³), followed by euryarchaeotal hyperthermophiles (Thermococci) (56%, P < 0.04), crenarchaeotal hyperthermophiles (Thermoprotei) (43%, P < 4 × 10⁻⁶), and euryarchaeotal Halobacteria (39%, P < 3 × 10⁻⁶). Even though methanogens of class Methanomicrobia are more closely related to Halobacteria than to other methanogens (Bapteste et al. 2005), they, too, possess a higher proportion of genes in operons (57%). This bias in higher density of operons in all methanogens can be attributed to the presence of an unusually large number of methanogen-specific gene clusters (Slesarev et al. 2002; Bapteste et al. 2005).
Operonization in archaeal genomes. (A) Phylogeny of 65 sequenced archaea and proportion of operon genes in each of the genomes. A species tree was constructed based on the concatenated alignments of ∼78 COGs by using FastTree (Price et al. 2010) and was retrieved from MicrobesOnline (Dehal et al. 2010). The species tree was drawn using the Interactive Tree of Life (Letunic and Bork 2007). Abbreviations for the strain names are listed in Supplemental Table S1. Four phylogenetically diverse strains which were mapped and compared by transcriptome architectures are colored in red (Pfu, Pyrococcus furiosus DSM 3638; Sso, Sulfolobus solfataricus P2; Mmp, Methanococcus maripaludis S2; Hsa, Halobacterium salinarum NRC-1). (B) Plot of optimal growth temperature [data from Prokaryotic Growth Temperature Database (Huang et al. 2004)] versus proportion of operon genes of each of 65 archaeal genomes. Color symbols denote different phyletic classes [green triangle down, Euryarchaeota—Halobacteria; yellow circle, Euryarchaeota—Methanogens (Methanobacteria, Methanococci, Methanomicrobia, and Methanopyri); blue triangle up, Euryarchaeota—hyperthermophiles (Thermococci); pink star, Crenarchaeota—Hyperthermophiles (Thermoprotei); gray diamond, Nanoarchaeota and Euryarchaeota—Archaeoglobi, Thermoplasmata]. (C) Classification of 100 conserved operons in the four extremophiles.
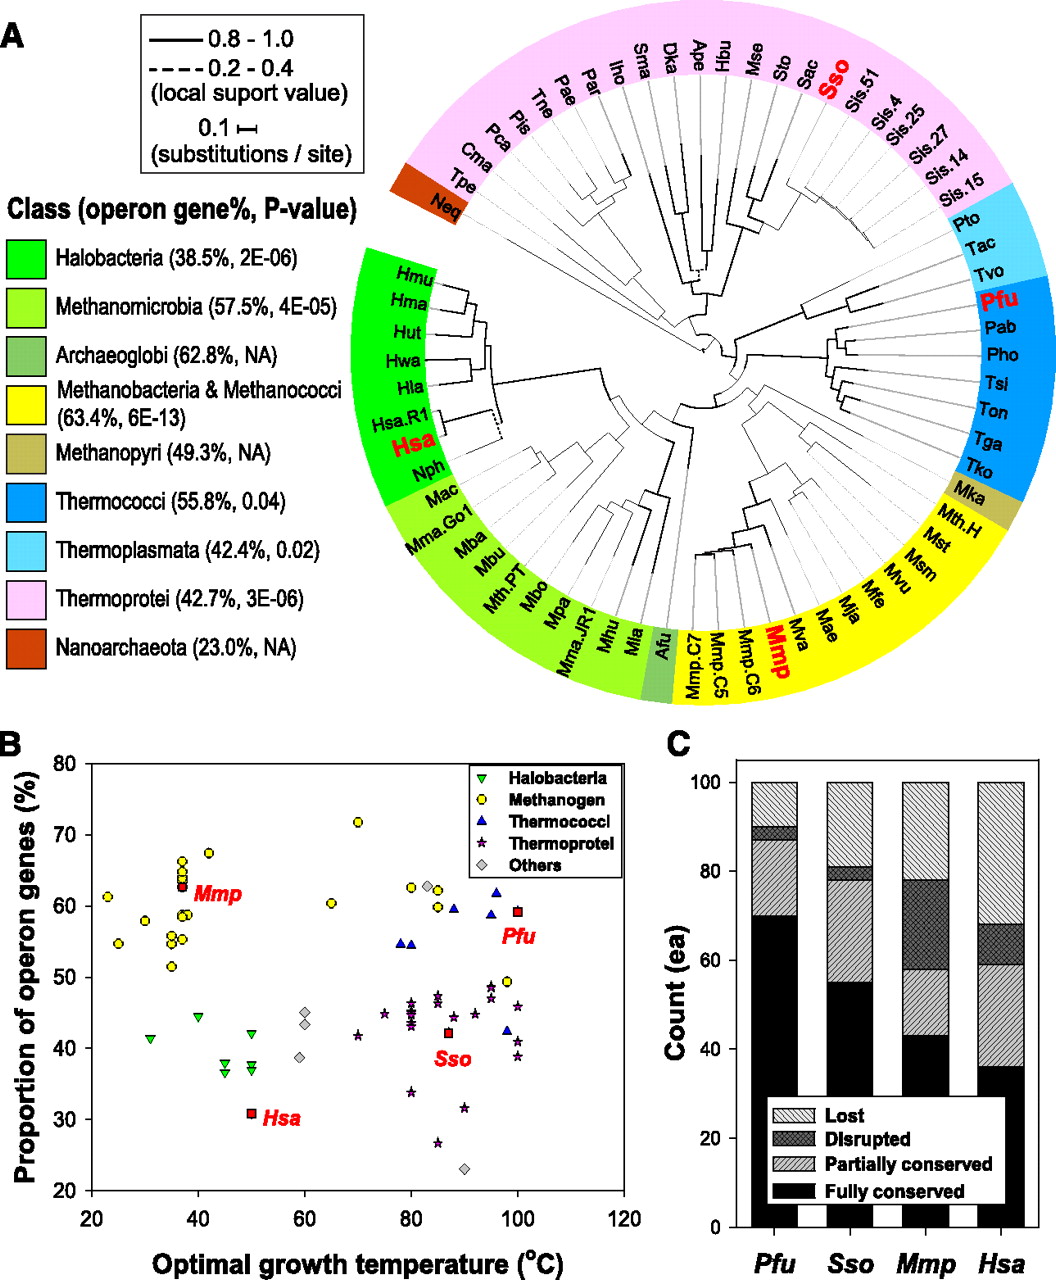
The organization of functionally linked genes into operons was hypothesized to be particularly beneficial to a thermophilic lifestyle as it could facilitate the assembly of enzyme complexes and thereby the associated processing of thermolabile metabolic intermediates (Glansdorff 1999). However, consistent with a previous analysis of gene order conservation (Wolf et al. 2001) across all fully sequenced archaeal genomes at the time, there was no correlation between degree of operonization and optimal growth temperature (Fig. 1B). Nonetheless, the lineage-specific trends suggest that it is possible to study operonization in action by investigating genome organization of organisms at varying stages of this process.
Discovery and classification of conserved operons
We investigated how genes get organized into operons by conducting comparative analysis of operon structures in Mmp, Pfu, Sso, and Hsa, which are model organisms in major archaeal lineages that possess characteristic lineage-specific trends in density of operon gene content (Fig. 1A). We first performed an all-against-all BLASTP search with soft filtering and Smith-Waterman alignments (Moreno-Hagelsieb and Latimer 2008). Subsequently, we identified putative orthologs and recent paralogs across these four organisms using the OrthoMCL algorithm (Li et al. 2003). Briefly, this method applies a Markov chain clustering (MCL) to a similarity matrix generated by log-transforming E-values of the reciprocal best hits (E-value ≤ 1 × 10⁻⁵ and ≥75% coverage) using 1.5 as the inflation parameter. Altogether, 5557 proteins (1112 from Hsa, 1119 from Mmp, 1345 from Pfu, and 1981 from Sso) were clustered into 1649 groups, of which 389 or 24% contain proteins from all four strains. Orthologs across the four archaeal genomes were mapped to predicted operons (Price et al. 2005), aligned by clusters of orthologous groups (COG) functional categories, and inspected manually. Operons conserved across at least two species were classified into the following four classes in terms of conservation of gene content (Itoh et al. 1999): “fully conserved''; ‘‘partially conserved''; ‘‘disrupted''; or ‘‘unknown'' (Supplemental Fig. S1). This identified 100 conserved operons, among which 28 were conserved across all four species, 26 were conserved across three species, and 46 were conserved across two species (Supplemental Fig. S2; Supplemental Table S2). Divergent operons that could not be aligned, such as those encoding subunits of membrane-associated hydrogenase and NADH dehydrogenase, were not included. As for nonhomologous genes in conserved operons, we identified insertion of horizontally transferred genes based on GC content (>1.5 σ) and codon usage (P < 0.05) (Yoon et al. 2005).
In general, we observed genomic rearrangements in most operons; in fact, only five sets of operons were identical in both gene content and gene order across all four organisms. These five operons are comprised of genes for ribosomal proteins, other translation processes, iron(III) ABC transporter, and oxoglutarate ferredoxin oxidoreductase (Supplemental Fig. S2). The genomes of Pfu and Sso were distinguished by the prevalent organization of amino acid biosynthesis genes into operons, while the orthologs of these genes were rarely clustered in Hsa and Mmp. A general theme emerging from our analysis was that the degree of operon conservation was highest in Pfu, followed by Sso, and operons were found to be least conserved in Mmp and Hsa (Fig. 1C). While Mmp showed high content of operon genes due to the presence of many methanogen-specific gene clusters (Fig. 1A; Slesarev et al. 2002), the tendency for breaking functionally related genes into different genomic locations and the presence of many operons with genes of seemingly unrelated function (Hendrickson et al. 2004) appears to have led to lower stability of operon structures in this organism (Fig. 1C).
Growth-associated dynamic changes in transcriptome architectures
We have previously demonstrated through TA analysis of Hsa that even the genome of a simple prokaryote is fraught with a higher than anticipated prevalence of transcriptional promoters inside genes and operons (Koide et al. 2009). Further, we demonstrated that conditional activation of such promoters results in dynamic changes in transcript structures originating from the same operon. In many cases, these promoters were present inside protein coding sequences. Subsequently, many studies have discovered similar phenomena in other organisms (Cho et al. 2009; Guell et al. 2009; Qiu et al. 2010) to redefine the relationship between coordinate gene regulation and genome organization of prokaryotes. We have now mapped TAs in three other archaea (Mmp, Sso, and Pfu) at varying stages of growth in batch cultures (Supplemental Fig. S3). This was done by hybridizing total RNA from different growth phases of each organism against high-resolution tiling microarrays that covered its entire genome with 244K 60-mer probes (see Supplemental Methods).
We determined TA for each of the four archaea and identified transcription units (TUs) of mono- and poly-cistronic mRNAs including noncoding RNAs (ncRNAs) and transcripts which were not annotated in the original genome sequence analysis. Transcription start sites (TSSs) and termination sites (TTSs) were determined for the majority of genes in Mmp, Pfu, and Sso (Table 1). Below, we summarize highlights from TA analysis of three of these four organisms with emphasis on some hallmark features of each organism; highlights from TA of H. salinarum NRC-1 have been previously reported (Koide et al. 2009).
Summary of genome, transcriptome architecture, and predicted operons of the four archaea
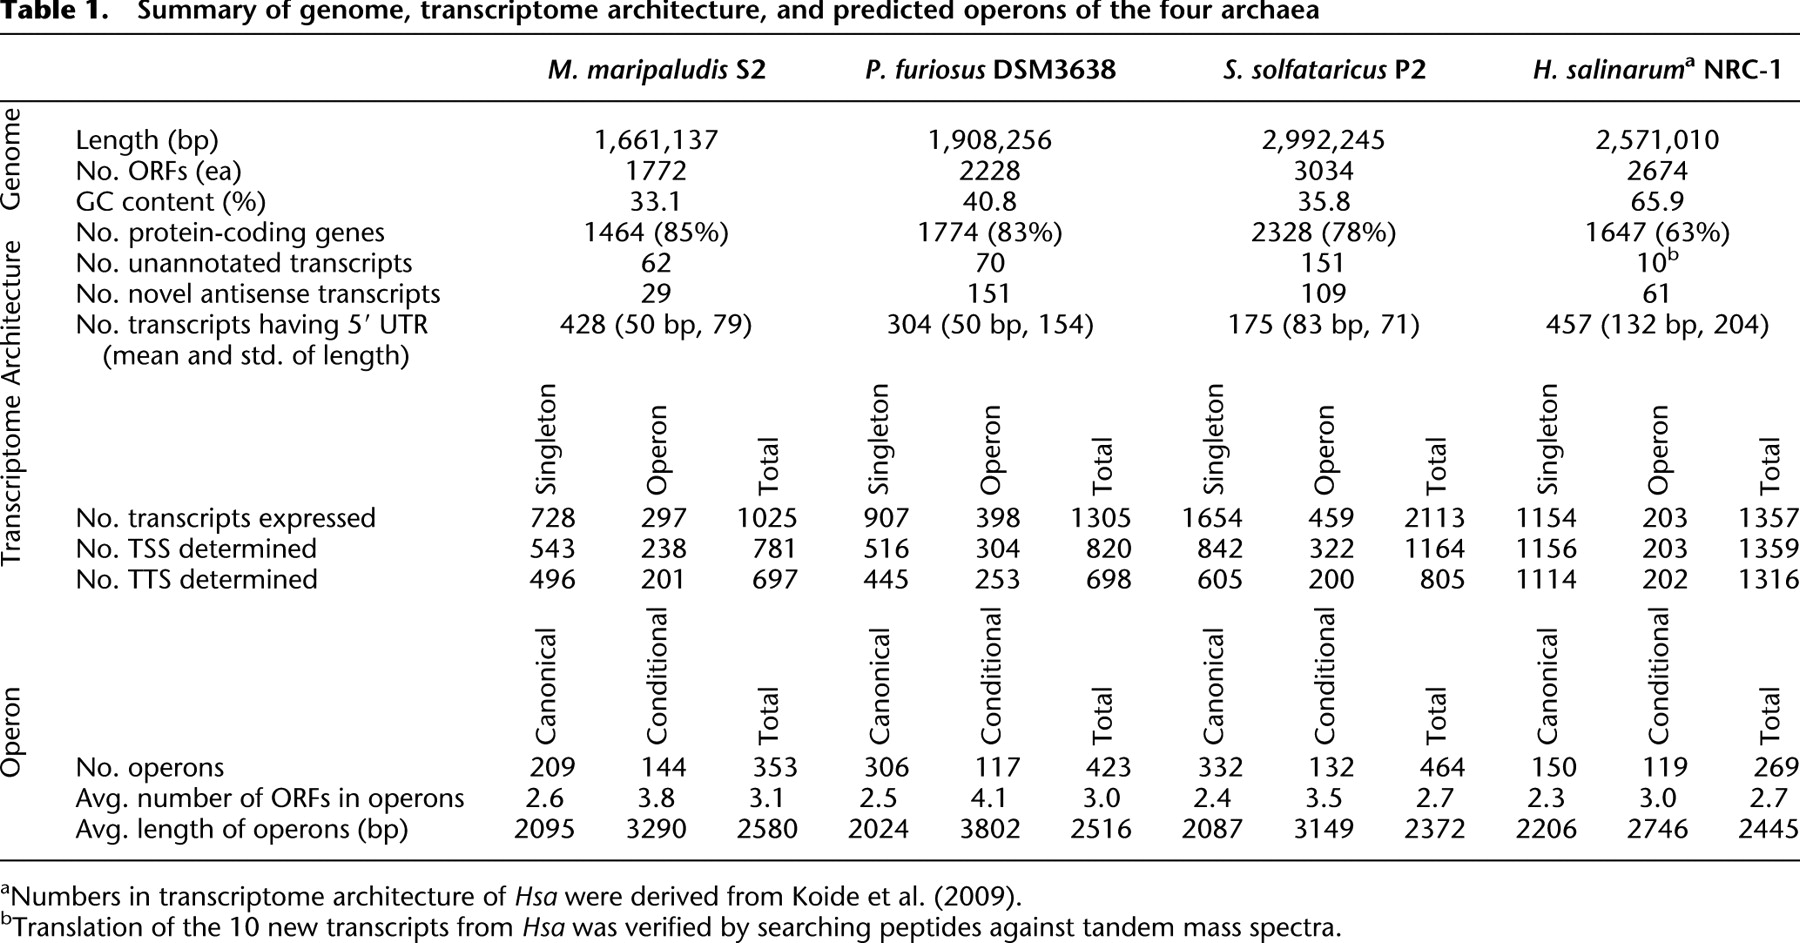
Transcriptome architecture of M. maripaludis S2
The 1.66 Mbp genome of Mmp is organized into a single large replicon with 1722 protein-coding genes (Hendrickson et al. 2004). We confirmed the transcription of 1464 (85%) protein-coding genes and were able to map 781 TSSs and 697 TTSs for 1025 TUs, of which 297 were polycistronic transcripts and 728 were monocistronic (Table 1; Supplemental Table S3). Given the resolution of probes on the tiling array (14 nt), only 25% (or 194) of TSSs that were within 14 nt of the start codon were considered to be leaderless transcripts. There was a wide distribution in the lengths of 5′ UTRs, with an average length of 50 nt and a standard deviation of 79. Long 5′ UTRs were also observed in the TA of Methanosarcia mazei (Jager et al. 2009). We also observed a wide distribution in the lengths of 3′ UTRs, with an average length of 68 nt and a standard deviation of 58 nt.
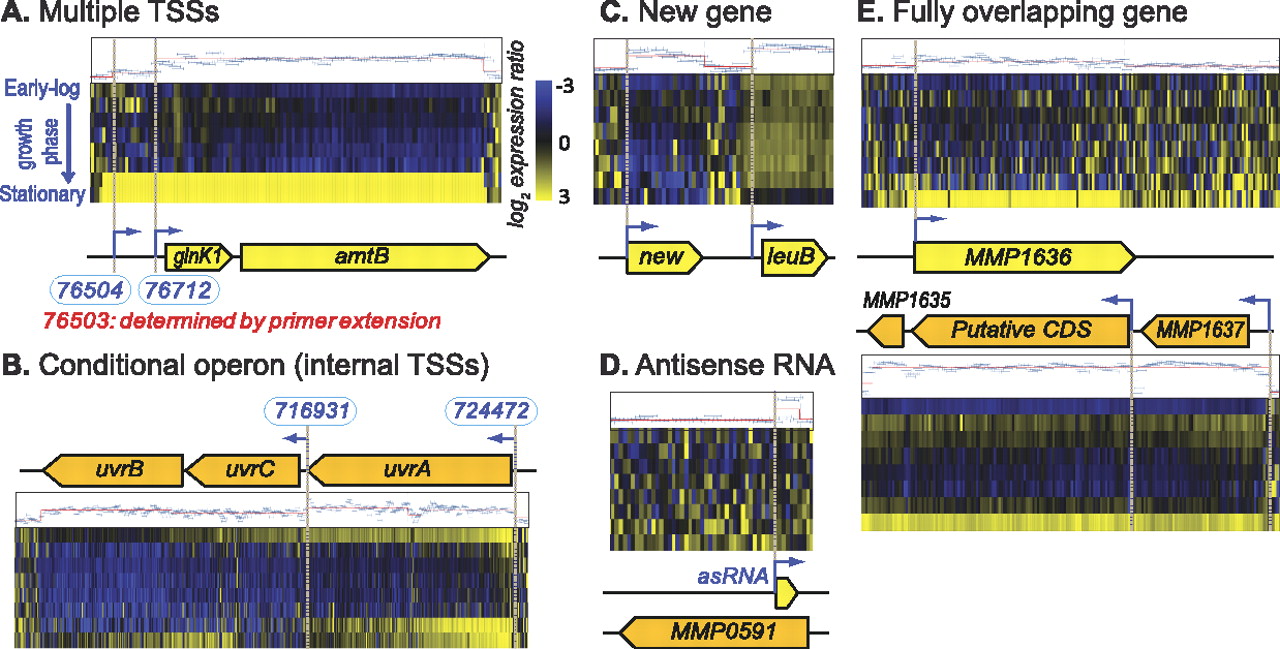
The growth associated-transcriptional changes revealed alternate TSSs for several genes including some involved in methanogenesis. Notable among those are alternate TSSs for glnK1 (nitrogen regulatory protein P-II), glnA (glutamine synthetase), and ehbC (putative monovalent cation/H+ antiporter subunit G). Location of one of the TSSs of glnK1 and glnA was almost identical to the TSS identified by primer extension (Fig. 2A; Lie et al. 2010). Analysis of the TA also identified conditional operons, i.e., multiple TUs covering the same set of genes due to conditional activation of promoters (or terminators) inside operons and coding sequences. It is possible that some of these alternate TUs are a product of transcript cleavage and processing, although we have previously demonstrated in H. salinarum NRC-1 that most of these sites are in fact bona fide TSSs (Fig. 2B; Koide et al. 2009). Remarkably, we also identified 62 transcripts that did not overlap any previously annotated coding sequences. BLASTX analysis of these transcripts against NCBI nonredundant (nr) database identified six additional genes (Supplemental Fig. 2C; Supplemental Table S4). At least 29 of these newly discovered transcripts are antisense to annotated genes (Fig. 2D; Supplemental Table S4). Finally, we discovered that at least five genomic loci in Mmp are transcribed on both strands with overlapping putative protein-coding genes (Fig. 2E).
Examples of dynamic changes in transcriptome architecture of M. maripaludis S2. The tiling array data were plotted against coordinates on the genome, and transcriptional units discovered by the automated segmentation approach were manually inspected and curated through interactive exploration in the Gaggle Genome Browser (Bare et al. 2010). Genes in the forward and reverse strands are shown in yellow and orange, respectively. Corresponding transcriptome architecture (TA) data are aligned above forward strand genes and below reverse strand genes. The blue horizontal bars represent probe intensity (log2 scale) at the corresponding genomic location for reference RNA, which was prepared from a mid-log phase culture. The overlaid red line is a model fit by a segmentation algorithm that was applied to determine breaks in transcript signals (i.e., TSSs and TTSs). The heat map indicates transcript level changes at eight time points over various phases of growth in batch culture ratios (log2 scale) relative to reference RNA (blue is down-regulated; yellow up-regulated). (A) Multiple TSSs. Transcription is initiated at two sites (blue bent arrows) upstream of the glnK1-amtB operon, which encodes nitrogen regulatory protein P-II and an ammonium transporter, respectively. Interestingly, one of these TSSs (76504) was discovered using primer extension, and the TSSs mapped by the two independent methodologies mapped within one nucleotide of each other. This example illustrates the power of global analysis in comprehensive analysis of TA. (B) Conditional operon. Analysis of predicted operon structures identifies unexpected conditional breaks in the organization of the operon during cellular responses in differing environments. The mechanisms for a broken operon could include conditional activation of internal promoters or terminators, or conditional cleavage and processing. We show one example of a conditional operon for three DNA repair genes uvrABC. (C) Discovery of a new gene. We have discovered at least 63 transcripts in genomic locations that were not assigned to any annotated features. Here, we show an example of a newly discovered transcript that encodes a protein homologous to a hypothetical protein from Methanococcus maripaludis C6 (E-value = 2 × 10⁻¹³). (D) Discovery of an antisense ncRNA. At least 28 antisense ncRNAs were discovered. The example shown is for an ncRNA that is antisense to the 5′ end of MMP0591. (E) Discovery of fully overlapping genes. We have identified transcription of the antisense strand of MMP1636 encoding a major facilitator transporter. This newly discovered gene is interspersed between and cotranscribed with MMP1635, a redox-active disulfide protein, and MMP1637, a hypothetical protein.
Transcriptome architecture of P. furiosus DSM 3638
The 1.91 Mb genome of Pfu encodes at least 2065 protein coding genes (Robb et al. 2001). Analysis of growth samples of Pfu identified 1305 TUs covering 1774 (86%) of the protein-coding genes encoded in the genome, of which 398 were polycistronic transcripts and 907 were monocistronic (Table 1; Supplemental Table S5). Among 70 unannotated transcripts discovered in this analysis, 13 had sequence matches to putative protein-coding genes in hyperthermophilic archaea (Pyrococcus and Thermococcus) and bacteria (Thermotoga) (Supplemental Table S6). One hundred and fifty-one putative antisense RNAs were identified (Supplemental Table S6).
As is the case for most genome annotations, the number of putative ORFs in the Pfu genome has been a subject of debate (Poole et al. 2005); the current GenBank annotation (RefSeq) includes 60 additional ORFs, such as PF0736.1n. Altogether, the revised genome annotation includes an additional 127 ORFs that were not reported in the original GenBank submission (Poole et al. 2005). Our tiling array analysis has validated transcription of at least 58 of these ORFs and discovered an additional 12 novel transcripts, of which two are antisense to annotated ORFs (Fig. 3A).
Examples of dynamic changes in transcriptome architecture of P. furiosus DSM 3638. (A) Identification of misannotation. While there was no transcription of the hypothetical protein-coding gene PF0736.1n (P_expressed = 0.16), a transcript was detected from the opposite strand and assigned to a new putative gene encoding a 74-amino acid (aa)-long protein. It should be noted that PF0736.1n was previously believed to be a bona fide gene based on RNA hybridization to a PCR-based double-stranded microarray (Poole et al. 2005). This example showcases the value of strand-specific analysis. (B) CRISPR/CAS system. In the Pyrococcus CRISPR-Cas system, the guide crRNAs were suggested to be processed and translocated to the Cmr complex by the ribonuclease Cas6. (a) We detected separate TUs for each cas6 and cmr gene cluster. (b) The relative change in these transcripts was highly correlated with changes in all seven CRISPR elements and a large number of computationally predicted small nucleolar RNAs (snoRNAs) (r > 0.9). Unexpectedly, the adjacent core cas genes (cas1, cas4, cas5t, cas6) and other cas genes (cst1 and cst2) had different transcriptional profiles, suggesting conditionally activated transcriptional elements within this operon. (c) While the core cas gene cluster at locus #1 was down-regulated throughout growth in batch culture, the cas genes at locus #2 were up-regulated (r ∼ 0.4). (C) Conditional regulation of MBH operon. Segmentation analysis identified three alternative TSSs: The first was located upstream of mbh1-9, an operon that encodes subunits of a putative Na+/H+ antiporter; the second was located upstream of mbh10-12 (hydrogenase 3 complex subunits [hycG and hycE]), and the third was located upstream of mbh13-14 (hycD and hycF). Interestingly, these TUs separate the transcription of membrane-associated proteins encoded by Mbh1-9 from the cytoplasmic proteins encoded by Mbh10-12 (Holden et al. 2001). We detected at least two ncRNAs that were antisense to the MBH operon; the ncRNA located at the 3′ end of the MBH operon was correlated with surR (r = 0.95). The location of the TSS for mbh1 detected by the segmentation analysis mapped to within 19 nt of the TSS that was previously determined by primer extension (Lipscomb et al. 2009). We also observed that the TSS for PF1422 was located 40 nt inside the coding sequence; notably, there is a start codon immediately internal to this TSS, suggesting that the originally assigned start codon for this gene is incorrect. (D) Amino acid biosynthesis operons. A distinguishing feature of Pfu is the clustering of amino acid biosynthesis operons (leucine, arginine, aromatic amino acids, tryptophan) in a contiguous stretch (34 kb, 1560860–1594957). Genes in the forward and reverse strands are shown in yellow and orange, respectively. Gene boundary is indicated with a dotted line when adjacent genes are overlapping and with a solid line if there is space between genes. Numbers below or above the arrows denote the positive intergenic distances. See Figure 2 for additional keys to interpreting notations in this figure. Examples of dynamic changes in TA of Sso can be found in Supplemental Material, and TA of Hsa has been reported in our previous publication (Koide et al. 2009).
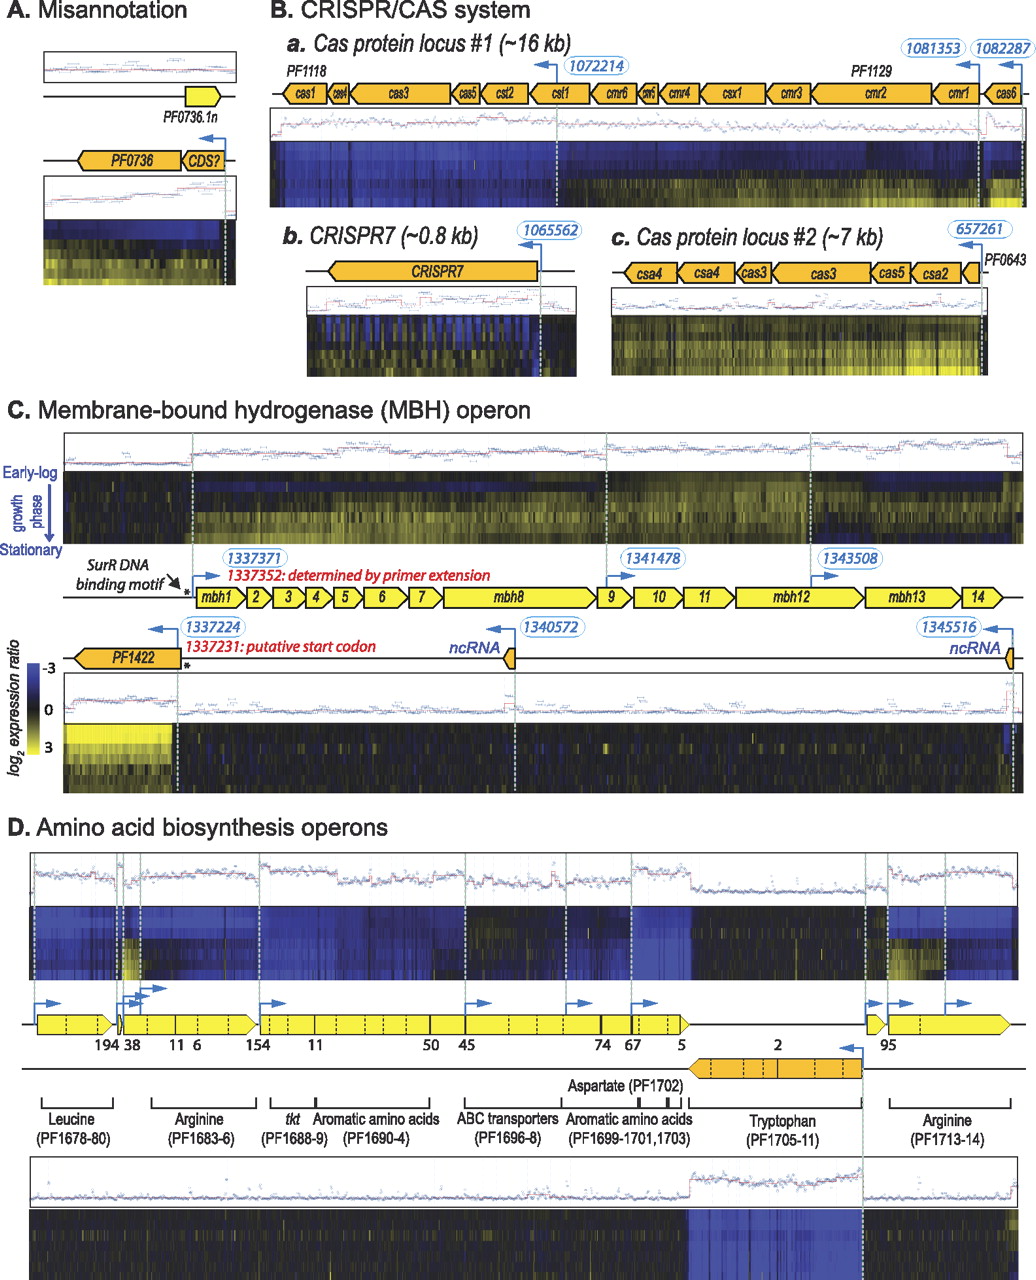
A hallmark of nearly 90% of sequenced archaeal genomes is a recently discovered RNA-directed anti-viral immune system encoded within clustered, regularly interspaced short palindromic repeats (CRISPRs) (Marraffini and Sontheimer 2010). The CRISPR locus typically contains short repeats (24, 25, or 30 bp) separated by nonrepetitive spacers (34–59 bp) with identical sequence matches to various phage genomes. We discovered that all seven CRISPRs in Pfu (Grissa et al. 2007) were expressed (P_expressed > 0.98). Unexpectedly, the expression of repeats and spacers in each CRISPR was quite different (Fig. 3B) which intriguingly suggests that expression of the immune system is controlled by a regulatory program that is triggered in the absence of viral attack. Another line of evidence for this was observed in the regulation by CRISPR-associated (Cas) proteins that are genomically adjacent to the CRISPR locus and implicated in the evolution of repeats within CRISPR and their post-transcriptional processing. In Pfu, the CRISPR RNA (crRNA) and RAMP module Cas proteins (Cmr) form a ribonucleoprotein complex that binds and cleaves complementary viral RNA (Hale et al. 2009). While the constitutive expression of cas genes at other loci is consistent with expression patterns of these genes in other organisms, the six cas genes located directly adjacent to the cmr genes were conditionally regulated during growth (Fig. 3B). We speculate that this growth/physiologic state-associated preparedness against anticipated viral attack is a reflection of a pattern of viral invasions experienced during the evolution of these organisms.
Conditional use of alternative TTSs was observed in a large putative operon (mbh1-14) encoding membrane-bound hydrogenase (MBH) which is primarily responsible for producing H2 during growth (Fig. 3C; Sapra et al. 2000; Jenney and Adams 2008). Divergent ORFs, mbh1 and PF1422 encoding thioredoxin reductase, shared the DNA-binding palindrome motif (GTTn3AAC, marked by asterisks) recognized by SurR transcriptional regulator of hydrogen and elemental sulfur metabolism in their upstream regions (Lipscomb et al. 2009). Strikingly, mbh1 was coexpressed with surR (r = 0.95), while the expression of PF1422 was anti-correlated with that of surR (r = −0.94). In a previous study, addition of SurR was reported to result in high expression of mbh1 in an in vitro transcription assay (Lipscomb et al. 2009). Taken together, our data suggests that SurR is a bifunctional transcriptional regulator that activates mbh1 and represses PF1422 by binding to the same DNA-binding site shared by the two promoters. Interestingly, we note that in support of the hypothesis that thermoadaptation is associated with increased operonization, we observed that operons for biosynthesis of leucine, arginine, aromatic amino acids, and tryptophan were clustered (34 kb, 1560860–1594957) (Fig. 3D).
Transcriptome architecture of S. solfataricus P2
The 2.99 Mbp genome of Sso contains a large number of repeat sequences with partial and full IS elements (∼10% of the genome) (She et al. 2001). With the exception of these elements for which transcript boundaries were hard to detect, we discovered 2113 TUs covering 2328 (78%) of the protein-coding genes, of which 459 were polycistronic transcripts and 1654 were monocistronic (Table 1; Supplemental Table S7). Nine hundred and twenty-eight TSSs of annotated genes identified in this study were not detected in the previously conducted deep sequencing analysis (Wurtzel et al. 2010). This could be attributed to differences in the two technologies (i.e., array vs. sequencing), differences in conditions under which the TAs were mapped, or differences in the approach—a strength of our approach is in the integration of dynamic transcriptional changes to improve sensitivity for mapping TSSs for transcripts present in low copy numbers. Of 638 TSSs that were determined by both methods, positional discrepancies were observed for 167 genes that mostly encode proteins of unknown functions or are associated with transposons (Supplemental Table S8). Only 175 (18%) of determined TSSs were associated with 5′ UTRs (>25-bp resolution), which agrees with the previous observation that the majority of Sso genes generate leaderless transcripts (Wurtzel et al. 2010).
We identified 151 transcripts from genomic segments with no previously annotated ORF (She et al. 2001; Supplemental Table S9). BLASTX search of these transcripts identified 97 putative novel proteins (query coverage > 34% and E-value < 5 × 10⁻⁶), of which 32 matched putative proteins identified in a previous study (Wurtzel et al. 2010; Supplemental Fig. S4A). In addition to validating expression of 277 (99%) of the previously reported 280 ncRNAs (mean P_expressed = 0.98, std = 0.06) (Supplemental Table S9; Omer et al. 2000; Tang et al. 2005; Zago et al. 2005; Gardner et al. 2009), we identified an additional 109 novel antisense RNAs. Notably, a large fraction of these ncRNAs (148) were antisense to transposon-related genes (Supplemental Fig. S4B), which is consistent with their hypothesized role in preventing excessive transposition (Tang et al. 2005; Wurtzel et al. 2010). Locations of four single transcripts covering large genomic regions (2–6.5 kb) with no sequence homology with nr proteins were almost identical to those of computationally predicted CRISPRs (Grissa et al. 2007; Supplemental Fig. S4C). The remaining three predicted CRISPRs at 1744007 (411 bp), 1809772 (1450 bp), and 1811328 (4230 bp) were not expressed (P_expressed < 0.5).
A large number of genes in Sso (868 gene pairs) are partially overlapping; 636 are co-directional (→→), 204 are convergent (→←), and 28 are divergent (←→) (Palleja et al. 2009). For 76 convergent or divergent genes that overlap by >25 bp, the probability of transcription in the overlapping regions (P_expressed = 0.64) was much lower relative to nonoverlapping regions (P_expressed = 0.95, t-test P-value = 6 × 10⁻¹⁷), which implies that only one strand in the overlapped segment is typically transcribed (Supplemental Table S10). This observation indicates that many of the overlaps between coding sequences of adjacent genes can be attributed to annotation errors (Palleja et al. 2008). For example, while the N terminus of SSO0627 was originally annotated as overlapping with the N terminus of purC, this annotation had to be revised through a subsequent proteome analysis (Cobucci-Ponzano et al. 2010). Consistent with this revised annotation, our TA analysis mapped the TSS of SSO0627 near a putative start codon that is 145 nt downstream from the originally misassigned start codon (Supplemental Fig. S4D).
Evolution of new promoters restores coordinated control of reorganized genes but also generates novel regulatory programs
Bacteria and archaea compete by streamlining their genomes through operonization of existing and newly acquired genes and deleting unnecessary genes. While such rearrangements could present an opportunity to evolve new regulatory programs, expand regulons, or split existing regulons, such indel events are random and are more often likely to be disruptive and detrimental. We assessed whether evolution of TA both explains how novel regulatory programs can evolve post-reorganization and how this process can also neutralize detrimental consequences of genome reorganization. We performed comparative analysis of conserved genes and operons across the phylogenetic tree of life to identify key reorganizational events in critical life functions. Subsequently, we assessed TAs of the relevant operons in the four organisms we have analyzed. We discuss striking insights into the role of TA evolution in the context of genome reorganization with five specific examples: ribosomal gene operon, the ATPase operon, and paralogous operons that arise through gene duplication events (Fig. 4).
Reorganization events within highly conserved operons. Operons for ribosomal proteins (A), ATP synthase (B), oligo/dipeptide transporter (C), hydrogenase (D), and RAMP module Cas proteins (E). Homologous genes are shown in the same color; red shaded genes do not have orthologs in the other three archaea. Arrows above the operons indicate direction and span of TUs determined in this study. The different arrow colors represent different expression patterns. For instance, secY in Mmp is transcribed as a monocistronic TU that is co-expressed with the large ribosomal operon. In contrast, secY in Sso is also transcribed as a separate TU, but its expression pattern is different from that of the large ribosomal operon. Dotted arrows indicate unexpressed ORF(s).
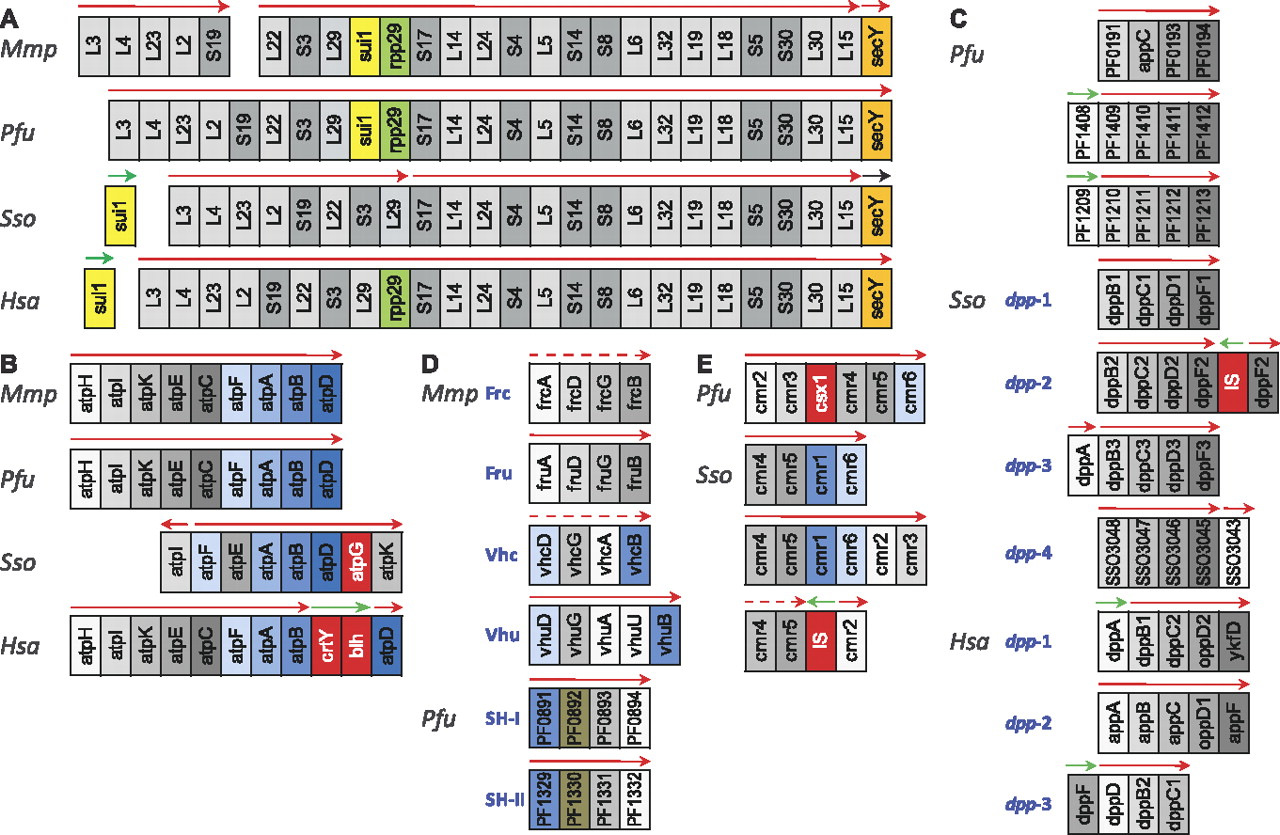
Origin of novel regulatory programs in protein-synthesis and trafficking genes
Gene content and organization in the largest ribosomal operon (13 kb with 22 ribosomal proteins and SecY secretion pathway protein) is highly conserved across most organisms (Fig. 4A). Interestingly, a gene encoding the large subunit protein L29 in Sso had a striking anomaly in its GC content (ΔGC = −7.4%) and codon usage (P < 1 ×10⁻⁷). Furthermore, Sso L29 is most sequence-similar to bacterial orthologs and those in the Thermoprotei class of Crenarchaeota. A less conserved and functionally important gene can be a result of an ancient duplication, differential loss, and gene conversion in bacterial genomes (Lathe and Bork 2001). However, (1) lack of evidence for a L29 parolog in the four archaeal genomes; (2) a long intergenic region (266 bp) between L29 and its downstream gene in Sso; and (3) the magnitude of the compositional bias all strongly suggest that L29 in Sso was recently acquired via HGT. Notably, TA analysis revealed that chromosomal integration of L29 disrupted the operon architecture while incorporating it into the native polycistronic transcriptional unit with other genes in the ribosomal operon of Sso (r ∼ 1, P = 0). Such precise in situ gene displacement within an operon by a horizontally acquired ortholog is believed to greatly increase its likelihood of evolutionary fixation (Omelchenko et al. 2003). This phenomenon is not new, as ribosomal proteins such as S14 (Brochier et al. 2000) and L29 (Omelchenko et al. 2003) are known to have been acquired via HGT by many bacteria. However, to our knowledge, this is the first report that an archaeal ribosomal protein was replaced via HGT by a bacterial ortholog without change to the local gene arrangement in the ribosomal operon.
Further analysis of this operon revealed that, whereas the translation initiation factor gene sui1 is at completely different genomic locations in Hsa and Sso, it has been incorporated into the ribosomal operon in Pfu and Mmp. Accordingly, whereas the regulation of this gene is not correlated with ribosomal genes in the former two organisms (r between rpl29 and sui1 in Hsa = 0.54; r in Sso = −0.94), as expected this genomic reorganization has resulted in cotranscription of this gene with the ribosomal operon in the latter two organisms.
Finally, the conserved location of secY, which encodes a secretion pathway protein, at the 3′ terminus of the ribosomal gene operon in nearly all bacterial and archaeal genomes is compelling evidence for its cotranscription with ribosomal genes. While this is, indeed, true for Hsa and Pfu, secY is, surprisingly, not cotranscribed with the ribosomal gene operon in Mmp and Sso, although it is coregulated with the ribosomal gene in the former but not in the latter (r in Mmp > 0.9; r in Sso ∼ 0.3) . There are two possible explanations: (1) secY is yet to be integrated into the ribosomal operon of both of these organisms; or (2) transcription of secY was recently split from the existing ribosomal operon in each of these organisms through the evolution of two cis-elements—a TTS to terminate ribosomal operon transcription and a TSS to initiate new transcription upstream of secY in both organisms. We favor the second explanation as it is highly unlikely that secY was independently incorporated into the same location of ribosomal operons across diverse organisms. It is noteworthy that, while there is some intergenic region to accommodate these cis-elements in Mmp, they are embedded within the coding sequence of rpl15p in Sso, suggesting that, relatively speaking, this is a more recent event in the latter.
Lineage specific reorganizations of the atp operon
ATPases are integral membrane complexes that generate a transmembrane ion gradient that drives ATP synthesis. A-type ATPases from archaea are phylogenetically closer to V-type ATPases of eukaryotic vacuoles than to F-type ATPases of bacteria and mitochondria (Schafer et al. 1999). Functions of the ATPase subunits are tightly coupled, and it is reasonable to expect that there is a strong selection pressure that drives their reorganization into operon-like structures. Nine ATPase subunit genes (atpHIKECFABD) of Mmp, Pfu, and Hsa are conserved as a single gene cluster (Fig. 4B). A-type ATPase is believed to have been horizontally transferred from euryarchaea to some bacteria such as Thermus and Firmicutes (Lapierre et al. 2006). One possible explanation for this lineage-specific distribution of these genes is that the A-type ATPase subunits were clustered into a single operon in Euryarchaeota and then transferred in its entirety to bacterial genomes. It appears that some genes of this operon are yet to be reorganized into an operon in some archaeal lineages, and this process is almost complete in some genomes such as Sulfolobales. Interestingly, one gene of this cluster (atpI) in Crenarchaeota-Sulfolobales, Korarchaeota, and Thaumarchaeota is yet to be integrated into this operon. This interim stage of genome reorganization is buffered by identical regulation of the two transcriptional units (r between transcriptional changes in atpI and atpFEABDGK = 0.98).
Recent genome reorganizational events have uniquely altered the structure of this operon in some halophilic archaea. First, incorporation of a novel gene VNG2146H upstream of the first gene (atpI) has resulted in 5′ extension of this operon in Hsa. Second, halophilic archaea can also generate ATP by light-driven proton pumping by bacteriorhodopsin (BR), which uses retinal as a chromophore (Schafer et al. 1999). Interestingly, two enzymes of the retinal biosynthesis pathway, blh (Peck et al. 2001) and crtY (Peck et al. 2002), that were acquired through HGT, are inserted into the atp operon of Hsa and Halomicrobium mukohataei, splitting the atpD gene from the rest of the atp operon. While the blh-crtY and atp operons are both involved in ATP synthesis, it is not clear how this benefits the halophiles, given that these genes are regulated in an exactly opposing manner under changing oxygen conditions (Schmid et al. 2007). Consistent with this and prior studies (Baliga et al. 2001, 2002; Bonneau et al. 2007), growth-associated regulation of crtY-blh transcript was also anti-correlated with atpIKECFAB (r ∼ −0.8) and highly correlated with other TUs of phototrophy genes including blp, bat-brp, and bop (r ∼ 0.9). Interestingly, our data reveal that the relatively new promoter of atpD is gaining similar regulatory control as that of the parent operon. However, this process is not complete as the expression of atpD and the other atp genes were moderately correlated (r ∼ 0.8), whereas there was perfect correlation across all genes within the intact operon (r ∼ 1).
Neofunctionalization through evolution of alternate transcriptional control in paralogous operons
The alignment of paralogs within a genome led to identification of several paralogous operons. We present three specific examples of operons for biosyntheses of oligo/dipeptide transporter, hydrogenase, and CRISPR-associated RAMP proteins. Oligopeptide (opp) and dipeptide (dpp) transport systems of the ATP-binding cassette (ABC) family are composed of five subunits: an extracellular oligo/dipeptide-binding protein (subunit A), two transmembrane proteins (subunits B and C) forming the pore, and two membrane-bound cytoplasmic ATP-binding proteins (subunits D and F) for ATP hydrolysis (Monnet 2003). Multiple copies of these operons in Pfu (3 ea), Sso (4 ea), and Hsa (3 ea) were differently regulated relative to each other (Fig. 4C). For example, during growth, dpp-1 and dpp-2 operons of Sso were up-regulated and the dpp-3 operon was down-regulated. There were also examples of differential regulation of member genes within operons that distinguished one paralogous copy from others. For instance, the dppA gene in the dpp-1 operon of Hsa was differentially expressed relative to dppBCDF. This could be explained by the presence of an alternate promoter within the longer intergenic distance (132 bp) between dppA and dppB of dpp-1 relative to that in dpp-2 (27 bp).
We also made interesting observations of differential control of paralogous hydrogenase gene operons in Mmp and Pfu (Fig. 4D). Mmp contains four gene clusters: two encode selenocysteine-containing hydrogenases—Fru (F420-reducing hydrogenase) and Vhu (non-F420-reducing hydrogenase); and two encode cysteine-containing isoenzymes (Frc and Vhc) (Hendrickson et al. 2004). The fru and vhu operons were up-regulated at stationary phase, while the frc and vhc genes were not expressed at any growth stage, consistent with the need for Se-starvation conditions for expression of these operons in Methanococcus voltae (Noll et al. 1999). Unlike Mmp, it appears that the paralogous hydrogenase operons in Pfu have complementary functions. The two gene clusters for cytoplasmic hydrogenases (SH-I, SH-II) in Pfu (Jenney and Adams 2008) had anti-correlated expression profiles (r ∼ −0.7). While the SH-I operon was up-regulated during the early growth stage, the SH-II operon genes were expressed at a later growth stage. This is the first example of differential regulation of two highly similar enzymes, both of which use nicotinamide nucleotides as electron carriers and differ primarily in their specific activities (Jenney and Adams 2008). Similarly, among the three gene clusters encoding RAMP module proteins in Sso, the expression of one (SSO1514-1510) was correlated to the four CRISPRs (r ∼ 0.8), another (SSO1987-1992) was anti-correlated (r ∼ −0.9), and the third was interrupted by insertion of an IS element and was not expressed (Fig. 4E).
All of these examples raise several hypotheses regarding the role of alternate regulatory schemes for paralogous operons. One hypothesis is that the differential regulation might serve as a buffering mechanism to prevent gene loss during neofunctionalization of these paralogous operons.
Conditionally activated transcriptional elements internal to operons buffer intermediate genome organizations during operonization
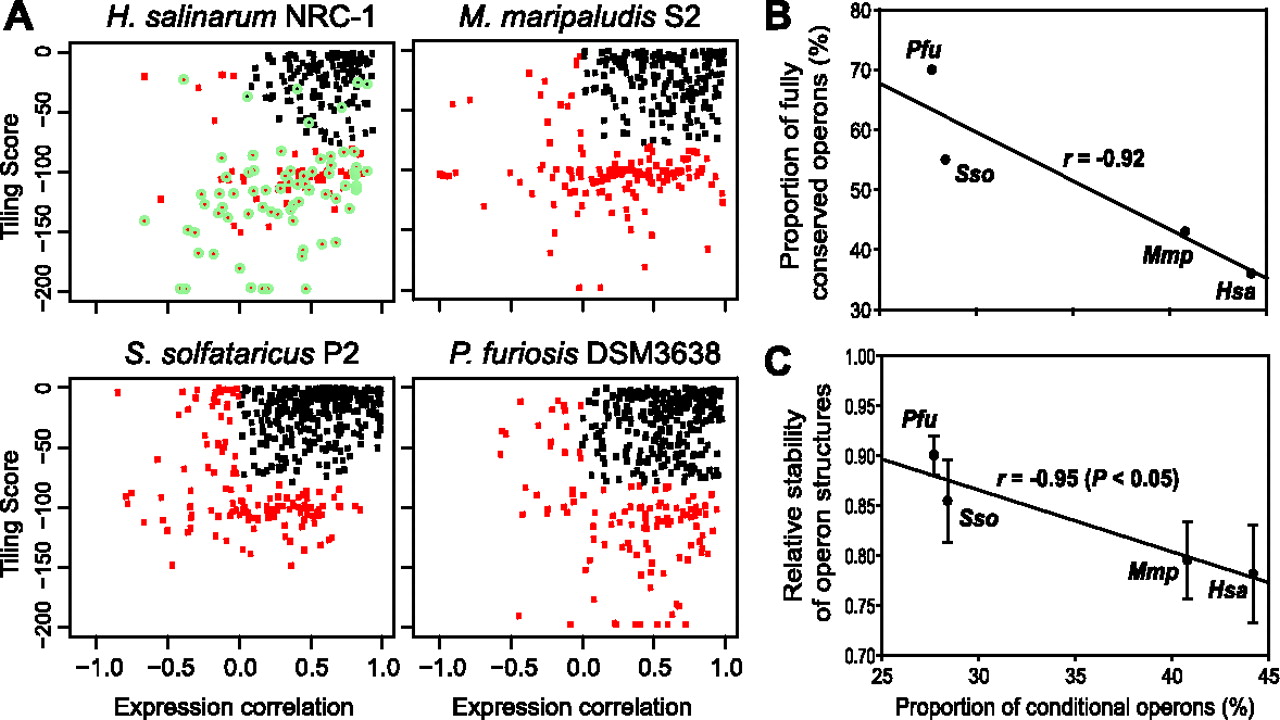
The comparative genome analysis revealed that degree of operon conservation was highest in Pfu, followed by Sso, Mmp, and Hsa (Fig. 1C). If this trend is a reflection of stages of operonization (assuming that the objective function of each organism is to achieve maximum operonization), then we should be able to detect signatures of this process in the TAs of these organisms. In an attempt to find such signatures, we analyzed the TAs of predicted operons in all four organisms by correlating their “tiling score”, i.e., uniformity of raw signal intensity of probes tiled across the entire operon, and correlation of changes in expression of genes within each operon in a bivariate “conditional operon plot” (Koide et al. 2009). Data for the tiling score were generated over the growth curve in this study, whereas gene expression correlations were calculated from data from this study and several other studies (see Methods). By definition, operons with high tiling scores are less likely to possess conditionally activated internal TSSs and TTSs, and this is reflected in a high degree of co-expression across member genes. Conversely, low tiling scores that are associated with low co-expression across member genes are strongly indicative of conditional behavior. In our previous study (Koide et al. 2009), we manually curated a large number of conditional vs. canonical operons and applied a classifier to those curations, using these two aforementioned independent scores. This same classifier was applied to the classification of operons in Sso, Mmp, and Pfu (Fig. 5A) in order to gain a global, unbiased measure of the prevalence of conditional operons in each organism (Supplemental Table S11). Analysis of TAs of Mmp, Sso, and Pfu using this approach revealed that conditional initiation and termination of transcription via evolution of cis-elements inside operons is a rule rather than an exception. Conditional behavior was discovered to be greater in Hsa (44.2%) and Mmp (40.8%) as compared to Sso (28.4%) and Pfu (27.7%) (Fig. 5A). Across the four organisms, there was no correlation between fraction of conditional operons and average length of operons, although in most cases (Pfu, Mmp, and Sso), longer operons had higher likelihood of being conditional (Supplemental Results; Supplemental Fig. S5). Remarkably, however, there is an inverse correlation (r = −0.92) between the proportion of operons with conditional behavior and the fraction of fully conserved operons (Fig. 5B). Also, the relative stability of operon structures, which were calculated based on the method of Itoh et al. (1999), anti-correlated with the proportion of conditional operons (r = −0.95, P-value < 0.05) (Fig. 5C). This can be interpreted in two ways: that operonization has progressed to varying stages in each of these four archaea in the direction of a hyperthermophilic lifestyle; or that hyperthermophiles have lower tolerance for operon disruptions. These interpretations are not mutually exclusive, although the latter interpretation is consistent with our observation that hyperthermophiles also have the highest operon stability among all archaea.
Conditional operons. (A) Conditional operons were discovered by integrating two scores: tiling score and expression correlation. “Tiling score” indicates uniformity of raw signal intensity of probes tiled across the entire operon; “expression correlation” was calculated from expression data from studies that probed responses of these organisms to a diverse set of environmental perturbations. Conditional operons in this bivariate “conditional operon plot” were identified previously in Hsa by extensive manual inspection (green circles) and used to train a classification model which separated conditional operons (red points) from canonical operons (black dots) (Koide et al. 2009). Our classifier accurately identified nearly all manually curated operons with conditional behavior. We have used the same classification criteria previously learned on Hsa to discover conditional operons in Mmp, Sso, and Pfu. (B) Plot of proportion of conditional operons versus proportion of fully conserved operons. (C) Plot of proportion of conditional operons versus proportion of relative stability of operons of each organism. Relative stability of operon was estimated using a previously published method (Itoh et al. 1999). Briefly, under the assumption of independent destruction of operon structures, comparison of operon structures in genome 1 with those of genomes 2 and 3 led to calculation of relative stabilities of operons in strain 2 and 3. Error bars represent the standard error in six values from multiple comparisons.
Discussion
Despite its discovery over four decades ago (Yanofsky 1967), the process of operonization and its role in adaptation have been unclear. In general, operons are poorly conserved during the random rearrangements of prokaryotic genomes during evolution (Itoh et al. 1999; Wolf et al. 2001). Even closely related species can have very different gene order, gene content, and regulatory mechanisms for orthologous operons (Lathe et al. 2000; Baliga et al. 2004). However, organization of genes within some operons is highly conserved across a wide range of species, possibly suggesting that their reorganization has detrimental consequences on the fitness of the organism (Lathe et al. 2000). It might be true that operons are transient products of natural selection for a streamlined genome (Koonin 2009), but it is challenging to experimentally evaluate in the laboratory whether re-organizing genes into operons improves fitness. This is because fitness enhancements by operonization are bound to be marginal and meaningful only in a highly competitive and dynamically changing complex environment. We have overcome this challenge by integrating comparative analysis of genome organization and TAs across phylogenetically diverse organisms to offer a fascinating model for the process of operonization (Fig. 6).
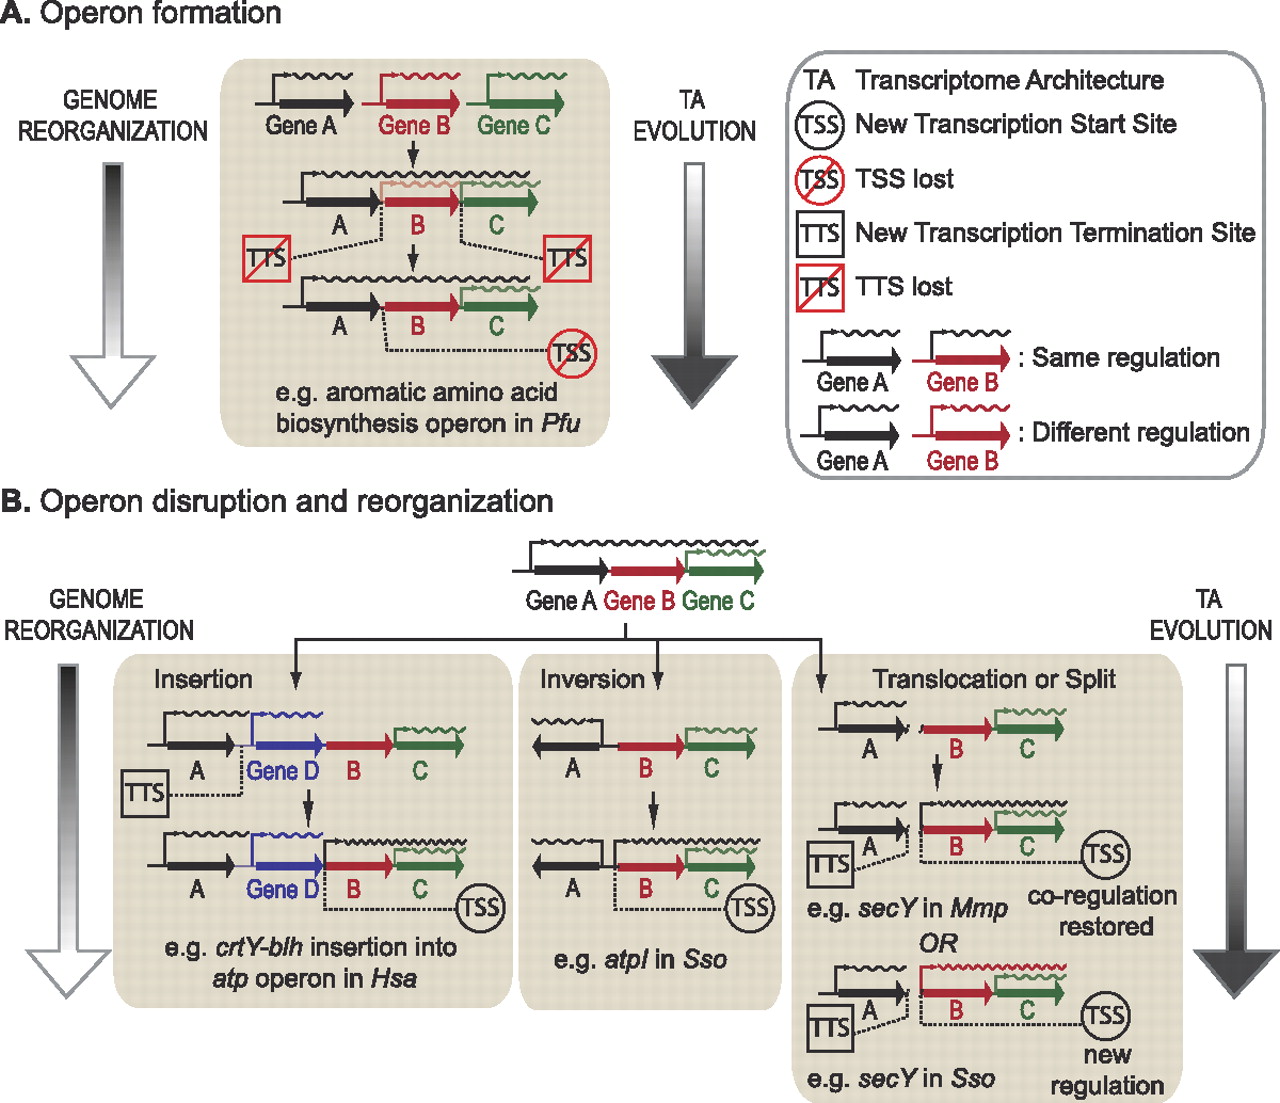
The role of parallel evolution of TA in buffering intermediate genome organization states during formation, disruption, and reorganization of operons. (A) Operon formation. The assembly of functionally linked genes occurs through genome organizational events that bring them into close proximity. Parallel evolution of the TA via spontaneous mutations modifies transcriptional signals in the form of generating new transcriptional elements (TSSs or TTSs) or killing existing elements to generate polycistronic transcripts. Some internal transcriptional elements are retained and used in a conditional manner (i.e., triggered or silenced as a function of environmental context) to accommodate alternate regulatory schemes in certain environments. Needless to say, all of these events are driven by natural selection as genome streamlining [assembly of genes into operons to increase coding density and deletion of unnecessary genomic elements (coding and noncoding)] is associated with gain of fitness over competition. (B) Operon disruption and reorganization. While the random nature of genome shuffling allows organisms to continually explore novel fitness landscapes in changing environments, it can also be detrimental as it results in disruption of existing operon structures more often than yielding new beneficial arrangements. The parallel evolution of TA continues to buffer the intermediate genome states by restoring coordinate transcriptional control of functionally linked genes (indicated in the examples illustrating insertion and inversion events). However, occasionally this dynamic process allows for the evolution of new regulatory schema as illustrated in the second example of a translocation or split event. We have provided specific examples as evidence to support the proposed model.
While there is evidence for in situ gene displacement within operons, most existing and horizontally acquired genes are randomly shuffled through indels and translocations (Omelchenko et al. 2003). It is intriguing, in this regard, that members of the same phylogenetic lineage have a similar degree of operonization despite having had sufficient time to shuffle and reorganize their genomes independent of one another (e.g., Haloarcula marismostui and Hsa within the Halobacteriaceae) (Fig. 1A,B; Balata et al. 2004). This observation suggests that there must be natural selection constraints (physiological and environmental) that keep the rate of operonization somewhat equivalent across members of the same lineage. In other words, we can hypothesize that operon reorganizational events are tolerated to a varying degree across lineages. Further, the inverse correlation between growth temperature and relative operon stability suggested that we could test this hypothesis through comparative analysis of operon reorganization in mesophilic (Hsa and Mmp) and hyperthermophilic (Pfu and Sso) organisms from phylogenetic lineages with distinct operon stabilities (Fig. 1C).
We first determined that it is indeed feasible to capture intermediate states of operon reorganization through comparative analysis of conserved operons and TAs of these four organisms. This comparative analysis has demonstrated that the genome shuffling is coupled to a second process of TA optimization that is also driven by random events. Our data suggest that this second evolutionary process selects for fitness-enhancing mutations that generate new transcriptional promoters and terminators and kill existing transcriptional cis-elements to integrate the reorganized genes into operons (Figs. 2–4). Our discovery of the widespread distribution of internally located transcriptional cis-elements has demonstrated that this process is not restricted to interoperonic or even intergenic regions. These internally located transcriptional cis-elements offer some flexibility to conditionally modulate the transcription of genes within operons, to accommodate alternate regulatory programs such as for enzymes at branch points of metabolic pathways (Ihmels et al. 2004), and to maintain stoichiometry of functionally linked genes (e.g., enzyme complexes) with environment-dependent variable turnover rates (Hayter et al. 2005). Thus, our analyses revealed TA evolution to be a fundamental mechanism that facilitates operonization and also plays an important role in neutralizing genome reorganizational events that result in disruption of existing operons (Fig. 6).
Importantly, this integrated analysis allowed us to assess the relative tolerance of operon reorganizational events in the four organisms. This revealed compelling evidence for the only hypothesis known to us that links operon stability with thermoadaptation (Glansdorff 1999). Previously, a count of the absolute numbers of operons across diverse lineages had refuted Glansdorff's hypothesis that operonization benefits hyperthermophiles more than it does mesophiles (Wolf et al. 2001). We have demonstrated that Glansdorff's hypothesis might be correct when evaluated in the context of operon stability as opposed to absolute numbers of genes in operons. Specifically, our discovery that the relative stability of operon structures was higher in hyperthermophiles (Pfu and Sso) than in mesophiles (Mmp and Hsa) (P-value < 0.03) unequivocally demonstrates that thermoadaptation might indeed be associated with higher operon stability (Fig. 1C) and fewer conditionally altered operon structures (Fig. 5). Alternatively, this data could be interpreted as evidence for lower tolerance for operon disruption in organisms adapted to higher growth temperatures. In other words, the rate at which genes get organized into operons might be similar across organisms and possibly dependent on rate of genome rearrangement. However, our data have shown conclusively that, once formed, an operon is less likely to survive disruption in a hyperthermophile, suggesting that such events might be associated with a significant loss of fitness at higher growth temperatures.
Methods
Identification of conserved operons among Mmp, Pfu, Sso, and Hsa
We first performed an all-against-all BLASTP search with soft filtering and Smith-Waterman alignments (Moreno-Hagelsieb and Latimer 2008). Subsequently, we identified putative orthologs and recent paralogs across these four organisms using the OrthoMCL algorithm (Li et al. 2003). Briefly this method applies a Markov chain clustering (MCL) to a similarity matrix generated by log-transforming E-values of the reciprocal best hits (E-value ≤ 1 × 10⁻⁵ and ≥75% coverage) using 1.5 as the inflation parameter. Altogether, 5557 proteins (1112 from Hsa, 1119 from Mmp, 1345 from Pfu, and 1981 from Sso) were clustered into 1649 groups, of which 389, or 24%, contain proteins from all four strains. Orthologs across the four archaeal genomes were mapped to predicted operons (Price et al. 2005), aligned by COG functional categories, and inspected manually. Divergent operons that could not be aligned, such as those encoding subunits of membrane-associated hydrogenase and NADH dehydrogenase, were not included. As for nonhomologous genes in conserved operons, we identified insertion of horizontally transferred genes based on GC content (>1.5 σ) and codon usage (P < 0.05) (Yoon et al. 2005).
Strains, culture conditions, sampling schedule, and RNA preparation
Methanococcus maripaludis MM901 is the wild type Methanococcus maripaludis S2 with an in-frame deletion of the uracil phosphoribosyltransferase gene (Costa et al. 2010). Pyrococcus furiosus DSM 3638 (Robb et al. 2001) and Sulfolobus solfataricus P2 (She et al. 2001) are wild-type strains.
Mmp was grown in a 1-L fermenter (Haydock et al. 2004), using the modifications to the medium and gases for nonlimiting conditions (Xia et al. 2009). Pfu was grown in stationary cultures at 98°C in closed bottles containing 1 L basic salts medium (Verhagen et al. 2001) without casein hydrolysate that was supplemented with maltose (3.0 g/L) and yeast extract (1.0 g/L). Sso was grown aerobically in a 1-L culture flask containing 400 mL mineral medium (Brock et al. 1972) supplemented with 0.2% tryptone and 0.1% yeast extract (80°C, pH of 3.0, agitation of 230 rpm) (Supplemental Fig. S3).
Up to eight samples were collected from each culture in a format that spanned the key phases of the growth curve. Cell pellets were collected by centrifugation and immediately frozen in an ethanol-dry ice bath (for Mmp) or liquid nitrogen (Pfu and Sso) and stored at −80°C. Total RNA was prepared with standard methodologies using the mirVana miRNA isolation kit (Applied Biosystems). Total RNA from each sample was compared against a reference RNA pool that was generated in bulk from a mid-log phase culture of each respective organism.
Construction of high-resolution tiling microarray, RNA hybridization, and image analysis
Whole-genome high-resolution tiling arrays for each strain were designed to contain 244K 60-mer probes with strand-specific sequences and manufacturer's controls (e-Array; Agilent Technologies). Probes were tiled every 14 nt for Mmp (GenBank genome accession: NC_005791) (Hendrickson et al. 2004), 16 nt for Pfu (NC_003413) (Robb et al. 2001), and 25 nt for Sso (NC_002754) (She et al. 2001). For genomic regions of special biological interest, probes were added with a tiling resolution of 5 nt.
Total RNA from samples of the growth curve and reference were directly labeled with Cy3 or Cy5 and were hybridized to the tiling array. After hybridization and washing according to the array manufacturer's instructions, the arrays were scanned by ScanArray (Perkin Elmer). Signal intensities and local backgrounds were determined by Feature Extraction software (Agilent Technologies). The resulting intensities were quantile-normalized to enforce all the arrays to have an identical intensity distribution. Log ratios were calculated for each probe (growth-curve sample/reference). Dye-flip experiments were done for each sample.
Determination of transcriptome architecture
Transcript boundaries were identified by integrating log intensity in reference RNA for a given probe location with its relative expression changes during growth, and correlation of these changes to corresponding changes measured by neighboring probes in the genome (Koide et al. 2009). The segmentation algorithm for defining transcript boundaries has been previously described in Koide et al. (2009). Briefly, the tiling array data were partitioned into regions of constant intensity, separated by abrupt “break points” by regression trees. The segments were validated and filtered. This procedure was jointly applied to all tiling arrays, constraining the segments in an integrated manner using the reference RNA and growth-curve tiling array samples, as well as the growth-curve correlations and the probe transcription probabilities. The tiling array data were plotted against coordinates on the genome, and TUs discovered by the automated segmentation approach were manually inspected and curated through interactive exploration in the Gaggle Genome Browser (Bare et al. 2010). Transcripts with “Probability expressed” (P_expressed) > 0.7 (as determined by this analysis) were considered as expressed. Expression ratios of each gene were calculated as the median value of expression ratios of probes assigned to the gene. Expression ratios of Hsa genes were calculated using our previous tiling data (Koide et al. 2009).
DNA sequences of transcripts that did not overlap previously annotated genes or ncRNAs were queried with BLASTX (Altschul et al. 1997) against nonredundant (nr) protein sequences and assigned to documented protein-coding genes when significant matches were discovered (E-value ≤ 1 × 10⁻⁴ and query coverage ≥ 30%). Small transcripts (<150 nt) that were complementary to repeat regions in the genome were removed if they contained a 12-nt contiguous sequence similarity with each other (Koide et al. 2009). Along with the transcripts that were antisense to annotated protein-coding sequences, small transcripts that did not match to any protein sequence in the nr database were considered to be ncRNAs. This classification is consistent with documented evidence that most (98%) of antisense RNA and small RNA, such as the family of box C/D and H/ACA, in archaeal strains (Klein et al. 2002; Tang et al. 2005; Zago et al. 2005; Muller et al. 2008) are <150 nt.
Identification of conditional operons
For predicted operons in each strain (Price et al. 2005), conditional behavior was identified by integrating expression data from this study with microarray data from public databases [NCBI Gene Expression Omnibus (GEO) and EBI ArrayExpress]. These public data sets included 108 Mmp microarrays for a mutant of Ehb membrane-associated hydrogenase (Porat et al. 2006), different growth rates, and growth under limiting hydrogen, phosphate, and leucine (Hendrickson et al. 2007, 2008); 55 Pfu microarrays for growth under gamma radiation (Williams et al. 2007), elemental sulfur (Schut et al. 2007), hydrogen peroxide (Strand et al. 2010), cold shock (Weinberg et al. 2005), and different carbon sources of peptides and maltose (Schut et al. 2003); and 54 Sso microarrays for infection by turreted icosahedral virus (Ortmann et al. 2008), growth under different oxygen concentrations (Simon et al. 2009), and UV radiation (Gotz et al. 2007). The conditional operons were estimated by integrating these public data with those from this study as described in Koide et al. (2009).
Data access
Tiling array data have been submitted to the NCBI Gene Expression Omnibus (GEO) (http://www.ncbi.nlm.nih.gov/geo/) under accession number GSE26782. All of the data and software tools developed in this study are available at http://baliga.systemsbiology.net/enigma/.
Acknowledgments
This work was supported by the U.S. Department of Energy, Award Nos. DE-FG02-07ER64327 and DG-FG02-08ER64685 (N.S.B.); the Office of Science (BER), U.S. Department of Energy, Award No. DE-FG02-08ER64685 (J.A.L.); the Office of Science (BES), U.S. Department of Energy, Award No. DE-FG05-95ER20175 (M.W.W.A.); and the National Science Foundation MRI, Grant No. 0923536 (R.L.M.). The work conducted by ENIGMA was supported by the Office of Science, Office of Biological and Environmental Research of the U. S. Department of Energy under Contract No. DE-AC02-05CH11231.
References
- ↵SF Altschul, TL Madden, AA Schaffer, J Zhang, Z Zhang, W Miller, DJ Lipman. 1997. Gapped BLAST and PSI-BLAST: A new generation of protein database search programs. Nucleic Acids Res 25: 3389–3402.
- ↵NS Baliga, SP Kennedy, WV Ng, L Hood, S DasSarma. 2001. Genomic and genetic dissection of an archaeal regulon. Proc Natl Acad Sci 98: 2521–2525.
- ↵NS Baliga, M Pan, YA Goo, EC Yi, DR Goodlett, K Dimitrov, P Shannon, R Aebersold, WV Ng, L Hood. 2002. Coordinate regulation of energy transduction modules in Halobacterium sp. analyzed by a global systems approach. Proc Natl Acad Sci 99: 14913–14918.
- ↵NS Baliga, R Bonneau, MT Facciotti, M Pan, G Glusman, EW Deutsch, P Shannon, Y Chiu, RS Weng, RR Gan, . 2004. Genome sequence of Haloarcula marismortui: A halophilic archaeon from the Dead Sea. Genome Res 14: 2221–2234.
- ↵E Bapteste, C Brochier, Y Boucher. 2005. Higher-level classification of the Archaea: Evolution of methanogenesis and methanogens. Archaea 1: 353–363.
- ↵JC Bare, T Koide, DJ Reiss, D Tenenbaum, NS Baliga. 2010. Integration and visualization of systems biology data in context of the genome. BMC Bioinformatics 11: 382. doi: 10.1186/1471-2105-11-382.
- ↵JE Barrick, DS Yu, SH Yoon, H Jeong, TK Oh, D Schneider, RE Lenski, JF Kim. 2009. Genome evolution and adaptation in a long-term experiment with Escherichia coli. Nature 461: 1243–1247.
- ↵R Bonneau, MT Facciotti, DJ Reiss, AK Schmid, M Pan, A Kaur, V Thorsson, P Shannon, MH Johnson, JC Bare, . 2007. A predictive model for transcriptional control of physiology in a free living cell. Cell 131: 1354–1365.
- ↵MS Bratlie, J Johansen, F Drablos. 2010. Relationship between operon preference and functional properties of persistent genes in bacterial genomes. BMC Genomics 11: 71. doi: 10.1186/1471-2164-11-71.
- ↵C Brochier, H Philippe, D Moreira. 2000. The evolutionary history of ribosomal protein RpS14: Horizontal gene transfer at the heart of the ribosome. Trends Genet 16: 529–533.
- ↵TD Brock, KM Brock, RT Belly, RL Weiss. 1972. Sulfolobus: A new genus of sulfur-oxidizing bacteria living at low pH and high temperature. Arch Mikrobiol 84: 54–68.
- ↵BK Cho, K Zengler, Y Qiu, YS Park, EM Knight, CL Barrett, Y Gao, BO Palsson. 2009. The transcription unit architecture of the Escherichia coli genome. Nat Biotechnol 27: 1043–1049.
- ↵B Cobucci-Ponzano, L Guzzini, D Benelli, P Londei, E Perrodou, O Lecompte, D Tran, J Sun, J Wei, EJ Mathur, . 2010. Functional characterization and high-throughput proteomic analysis of interrupted genes in the archaeon Sulfolobus solfataricus. J Proteome Res 9: 2496–2507.
- ↵KC Costa, PM Wong, T Wang, TJ Lie, JA Dodsworth, I Swanson, JA Burn, M Hackett, JA Leigh. 2010. Protein complexing in a methanogen suggests electron bifurcation and electron delivery from formate to heterodisulfide reductase. Proc Natl Acad Sci 107: 11050–11055.
- ↵NJ Croucher, NR Thomson. 2010. Studying bacterial transcriptomes using RNA-seq. Curr Opin Microbiol 13: 619–624.
- ↵PS Dehal, MP Joachimiak, MN Price, JT Bates, JK Baumohl, D Chivian, GD Friedland, KH Huang, K Keller, PS Novichkov, . 2010. MicrobesOnline: An integrated portal for comparative and functional genomics. Nucleic Acids Res 38: D396–D400.
- ↵PP Gardner, J Daub, JG Tate, EP Nawrocki, DL Kolbe, S Lindgreen, AC Wilkinson, RD Finn, S Griffiths-Jones, SR Eddy, . 2009. Rfam: Updates to the RNA families database. Nucleic Acids Res 37: D136–D140.
- ↵N Glansdorff. 1999. On the origin of operons and their possible role in evolution toward thermophily. J Mol Evol 49: 432–438.
- ↵D Gotz, S Paytubi, S Munro, M Lundgren, R Bernander, MF White. 2007. Responses of hyperthermophilic crenarchaea to UV irradiation. Genome Biol 8: R220. doi: 10.1186/gb-2007-8-10-r220.
- ↵I Grissa, G Vergnaud, C Pourcel. 2007. The CRISPRdb database and tools to display CRISPRs and to generate dictionaries of spacers and repeats. BMC Bioinformatics 8: 172. doi: 10.1186/1471-2105-8-172.
- ↵M Guell, V van Noort, E Yus, WH Chen, J Leigh-Bell, K Michalodimitrakis, T Yamada, M Arumugam, T Doerks, S Kuhner, . 2009. Transcriptome complexity in a genome-reduced bacterium. Science 326: 1268–1271.
- ↵CR Hale, P Zhao, S Olson, MO Duff, BR Graveley, L Wells, RM Terns, MP Terns. 2009. RNA-guided RNA cleavage by a CRISPR RNA-Cas protein complex. Cell 139: 945–956.
- ↵DR Harris, SV Pollock, EA Wood, RJ Goiffon, AJ Klingele, EL Cabot, W Schackwitz, J Martin, J Eggington, TJ Durfee, . 2009. Directed evolution of ionizing radiation resistance in Escherichia coli. J Bacteriol 191: 5240–5252.
- ↵AK Haydock, I Porat, WB Whitman, JA Leigh. 2004. Continuous culture of Methanococcus maripaludis under defined nutrient conditions. FEMS Microbiol Lett 238: 85–91.
- ↵JR Hayter, MK Doherty, C Whitehead, H McCormack, SJ Gaskell, RJ Beynon. 2005. The subunit structure and dynamics of the 20S proteasome in chicken skeletal muscle. Mol Cell Proteomics 4: 1370–1381.
- ↵EL Hendrickson, R Kaul, Y Zhou, D Bovee, P Chapman, J Chung, E Conway de Macario, JA Dodsworth, W Gillett, DE Graham, . 2004. Complete genome sequence of the genetically tractable hydrogenotrophic methanogen Methanococcus maripaludis. J Bacteriol 186: 6956–6969.
- ↵EL Hendrickson, AK Haydock, BC Moore, WB Whitman, JA Leigh. 2007. Functionally distinct genes regulated by hydrogen limitation and growth rate in methanogenic Archaea. Proc Natl Acad Sci 104: 8930–8934.
- ↵EL Hendrickson, Y Liu, G Rosas-Sandoval, I Porat, D Soll, WB Whitman, JA Leigh. 2008. Global responses of Methanococcus maripaludis to specific nutrient limitations and growth rate. J Bacteriol 190: 2198–2205.
- ↵CD Herring, A Raghunathan, C Honisch, T Patel, MK Applebee, AR Joyce, TJ Albert, FR Blattner, D van den Boom, CR Cantor, . 2006. Comparative genome sequencing of Escherichia coli allows observation of bacterial evolution on a laboratory timescale. Nat Genet 38: 1406–1412.
- ↵JF Holden, FL Poole II, SL Tollaksen, CS Giometti, H Lim, JR Yates III, MW Adams. 2001. Identification of membrane proteins in the hyperthermophilic archaeon Pyrococcus furiosus using proteomics and prediction programs. Comp Funct Genomics 2: 275–288.
- ↵SL Huang, LC Wu, HK Liang, KT Pan, JT Horng, MT Ko. 2004. PGTdb: A database providing growth temperatures of prokaryotes. Bioinformatics 20: 276–278.
- ↵J Ihmels, R Levy, N Barkai. 2004. Principles of transcriptional control in the metabolic network of Saccharomyces cerevisiae. Nat Biotechnol 22: 86–92.
- ↵T Itoh, K Takemoto, H Mori, T Gojobori. 1999. Evolutionary instability of operon structures disclosed by sequence comparisons of complete microbial genomes. Mol Biol Evol 16: 332–346.
- ↵D Jager, CM Sharma, J Thomsen, C Ehlers, J Vogel, RA Schmitz. 2009. Deep sequencing analysis of the Methanosarcina mazei Go1 transcriptome in response to nitrogen availability. Proc Natl Acad Sci 106: 21878–21882.
- ↵FE Jenney Jr, MW Adams. 2008. Hydrogenases of the model hyperthermophiles. Ann N Y Acad Sci 1125: 252–266.
- ↵RJ Klein, Z Misulovin, SR Eddy. 2002. Noncoding RNA genes identified in AT-rich hyperthermophiles. Proc Natl Acad Sci 99: 7542–7547.
- ↵T Koide, DJ Reiss, JC Bare, WL Pang, MT Facciotti, AK Schmid, M Pan, B Marzolf, PT Van, FY Lo, . 2009. Prevalence of transcription promoters within archaeal operons and coding sequences. Mol Syst Biol 5: 285. doi: 10.1038/msb.2009.42.
- ↵EV Koonin. 2009. Evolution of genome architecture. Int J Biochem Cell Biol 41: 298–306.
- ↵EV Koonin, YI Wolf. 2008. Genomics of bacteria and archaea: The emerging dynamic view of the prokaryotic world. Nucleic Acids Res 36: 6688–6719.
- ↵P Lapierre, R Shial, JP Gogarten. 2006. Distribution of F- and A/V-type ATPases in Thermus scotoductus and other closely related species. Syst Appl Microbiol 29: 15–23.
- ↵Lathe WC III, P Bork. 2001. Evolution of tuf genes: Ancient duplication, differential loss, and gene conversion. FEBS Lett 502: 113–116.
- ↵Lathe WC III, B Snel, P Bork. 2000. Gene context conservation of a higher order than operons. Trends Biochem Sci 25: 474–479.
- ↵I Letunic, P Bork. 2007. Interactive Tree Of Life (iTOL): An online tool for phylogenetic tree display and annotation. Bioinformatics 23: 127–128.
- ↵L Li, CJ Stoeckert Jr, DS Roos. 2003. OrthoMCL: Identification of ortholog groups for eukaryotic genomes. Genome Res 13: 2178–2189.
- ↵TJ Lie, EL Hendrickson, UM Niess, BC Moore, AK Haydock, JA Leigh. 2010. Overlapping repressor binding sites regulate expression of the Methanococcus maripaludis glnK1 operon. Mol Microbiol 75: 755–762.
- ↵GL Lipscomb, AM Keese, DM Cowart, GJ Schut, M Thomm, MW Adams, RA Scott. 2009. SurR: A transcriptional activator and repressor controlling hydrogen and elemental sulphur metabolism in Pyrococcus furiosus. Mol Microbiol 71: 332–349.
- ↵LA Marraffini, EJ Sontheimer. 2010. CRISPR interference: RNA-directed adaptive immunity in bacteria and archaea. Nat Rev Genet 11: 181–190.
- ↵V Monnet. 2003. Bacterial oligopeptide-binding proteins. Cell Mol Life Sci 60: 2100–2114.
- ↵G Moreno-Hagelsieb, K Latimer. 2008. Choosing BLAST options for better detection of orthologs as reciprocal best hits. Bioinformatics 24: 319–324.
- ↵S Muller, F Leclerc, I Behm-Ansmant, JB Fourmann, B Charpentier, C Branlant. 2008. Combined in silico and experimental identification of the Pyrococcus abyssi H/ACA sRNAs and their target sites in ribosomal RNAs. Nucleic Acids Res 36: 2459–2475.
- ↵I Noll, S Muller, A Klein. 1999. Transcriptional regulation of genes encoding the selenium-free [NiFe]-hydrogenases in the archaeon Methanococcus voltae involves positive and negative control elements. Genetics 152: 1335–1341.
- ↵MV Omelchenko, KS Makarova, YI Wolf, IB Rogozin, EV Koonin. 2003. Evolution of mosaic operons by horizontal gene transfer and gene displacement in situ. Genome Biol 4: R55. doi: 10.1186/gb-2003-4-9-r55.
- ↵AD Omer, TM Lowe, AG Russell, H Ebhardt, SR Eddy, PP Dennis. 2000. Homologs of small nucleolar RNAs in Archaea. Science 288: 517–522.
- ↵AC Ortmann, SK Brumfield, J Walther, K McInnerney, SJ Brouns, HJ van de Werken, B Bothner, T Douglas, J van de Oost, MJ Young. 2008. Transcriptome analysis of infection of the archaeon Sulfolobus solfataricus with Sulfolobus turreted icosahedral virus. J Virol 82: 4874–4883.
- ↵A Palleja, ED Harrington, P Bork. 2008. Large gene overlaps in prokaryotic genomes: Result of functional constraints or mispredictions? BMC Genomics 9: 335. doi: 10.1186/1471-2164-9-335.
- ↵A Palleja, T Reverter, S Garcia-Vallve, A Romeu. 2009. PairWise Neighbours database: Overlaps and spacers among prokaryote genomes. BMC Genomics 10: 281. doi: 10.1186/1471-2164-10-281.
- ↵RF Peck, C Echavarri-Erasun, EA Johnson, WV Ng, SP Kennedy, L Hood, S DasSarma, MP Krebs. 2001. brp and blh are required for synthesis of the retinal cofactor of bacteriorhodopsin in Halobacterium salinarum. J Biol Chem 276: 5739–5744.
- ↵RF Peck, EA Johnson, MP Krebs. 2002. Identification of a lycopene β-cyclase required for bacteriorhodopsin biogenesis in the archaeon Halobacterium salinarum. J Bacteriol 184: 2889–2897.
- ↵TT Perkins, RA Kingsley, MC Fookes, PP Gardner, KD James, L Yu, SA Assefa, M He, NJ Croucher, DJ Pickard, . 2009. A strand-specific RNA-Seq analysis of the transcriptome of the typhoid bacillus Salmonella typhi. PLoS Genet 5: e1000569. doi: 10.1371/journal.pgen.1000569.
- ↵FL Poole II, BA Gerwe, RC Hopkins, GJ Schut, MV Weinberg, FE Jenney Jr, MW Adams. 2005. Defining genes in the genome of the hyperthermophilic archaeon Pyrococcus furiosus: Implications for all microbial genomes. J Bacteriol 187: 7325–7332.
- ↵I Porat, W Kim, EL Hendrickson, Q Xia, Y Zhang, T Wang, F Taub, BC Moore, IJ Anderson, M Hackett, . 2006. Disruption of the operon encoding Ehb hydrogenase limits anabolic CO2 assimilation in the archaeon Methanococcus maripaludis. J Bacteriol 188: 1373–1380.
- ↵MN Price, KH Huang, EJ Alm, AP Arkin. 2005. A novel method for accurate operon predictions in all sequenced prokaryotes. Nucleic Acids Res 33: 880–892.
- ↵MN Price, AP Arkin, EJ Alm. 2006. The life-cycle of operons. PLoS Genet 2: e96. doi: 10.1371/journal.pgen.0020096.
- ↵MN Price, PS Dehal, AP Arkin. 2010. FastTree 2—approximately maximum-likelihood trees for large alignments. PLoS ONE 5: e9490. doi: 10.1371/journal.pone.0009490.
- ↵Y Qiu, BK Cho, YS Park, D Lovley, BO Palsson, K Zengler. 2010. Structural and operational complexity of the Geobacter sulfurreducens genome. Genome Res 20: 1304–1311.
- ↵FT Robb, DL Maeder, JR Brown, J DiRuggiero, MD Stump, RK Yeh, RB Weiss, DM Dunn. 2001. Genomic sequence of hyperthermophile, Pyrococcus furiosus: Implications for physiology and enzymology. Methods Enzymol 330: 134–157.
- ↵EP Rocha. 2008. The organization of the bacterial genome. Annu Rev Genet 42: 211–233.
- ↵R Sapra, MF Verhagen, MW Adams. 2000. Purification and characterization of a membrane-bound hydrogenase from the hyperthermophilic archaeon Pyrococcus furiosus. J Bacteriol 182: 3423–3428.
- ↵G Schafer, M Engelhard, V Muller. 1999. Bioenergetics of the Archaea. Microbiol Mol Biol Rev 63: 570–620.
- ↵AK Schmid, DJ Reiss, A Kaur, M Pan, N King, PT Van, L Hohmann, DB Martin, NS Baliga. 2007. The anatomy of microbial cell state transitions in response to oxygen. Genome Res 17: 1399–1413.
- ↵GJ Schut, SD Brehm, S Datta, MW Adams. 2003. Whole-genome DNA microarray analysis of a hyperthermophile and an archaeon: Pyrococcus furiosus grown on carbohydrates or peptides. J Bacteriol 185: 3935–3947.
- ↵GJ Schut, SL Bridger, MW Adams. 2007. Insights into the metabolism of elemental sulfur by the hyperthermophilic archaeon Pyrococcus furiosus: Characterization of a coenzyme A- dependent NAD(P)H sulfur oxidoreductase. J Bacteriol 189: 4431–4441.
- ↵Q She, RK Singh, F Confalonieri, Y Zivanovic, G Allard, MJ Awayez, CC Chan-Weiher, IG Clausen, BA Curtis, A De Moors, . 2001. The complete genome of the crenarchaeon Sulfolobus solfataricus P2. Proc Natl Acad Sci 98: 7835–7840.
- ↵G Simon, J Walther, N Zabeti, Y Combet-Blanc, R Auria, J van der Oost, L Casalot. 2009. Effect of O2 concentrations on Sulfolobus solfataricus P2. FEMS Microbiol Lett 299: 255–260.
- ↵AI Slesarev, KV Mezhevaya, KS Makarova, NN Polushin, OV Shcherbinina, VV Shakhova, GI Belova, L Aravind, DA Natale, IB Rogozin, . 2002. The complete genome of hyperthermophile Methanopyrus kandleri AV19 and monophyly of archaeal methanogens. Proc Natl Acad Sci 99: 4644–4649.
- ↵K Sneppen, S Pedersen, S Krishna, I Dodd, S Semsey. 2010. Economy of operon formation: Cotranscription minimizes shortfall in protein complexes. MBio 1: 3–5.
- ↵R Sorek, P Cossart. 2010. Prokaryotic transcriptomics: A new view on regulation, physiology, and pathogenicity. Nat Rev Genet 11: 9–16.
- ↵DL Stern, V Orgogozo. 2008. The loci of evolution: How predictable is genetic evolution? Evolution 62: 2155–2177.
- ↵KR Strand, C Sun, T Li, FE Jenney Jr, GJ Schut, MW Adams. 2010. Oxidative stress protection and the repair response to hydrogen peroxide in the hyperthermophilic archaeon Pyrococcus furiosus and in related species. Arch Microbiol 192: 447–459.
- ↵TH Tang, N Polacek, M Zywicki, H Huber, K Brugger, R Garrett, JP Bachellerie, A Huttenhofer. 2005. Identification of novel noncoding RNAs as potential antisense regulators in the archaeon Sulfolobus solfataricus. Mol Microbiol 55: 469–481.
- ↵A Toledo-Arana, O Dussurget, G Nikitas, N Sesto, H Guet-Revillet, D Balestrino, E Loh, J Gripenland, T Tiensuu, K Vaitkevicius, . 2009. The Listeria transcriptional landscape from saprophytism to virulence. Nature 459: 950–956.
- ↵MF Verhagen, AL Menon, GJ Schut, MW Adams. 2001. Pyrococcus furiosus: Large-scale cultivation and enzyme purification. Methods Enzymol 330: 25–30.
- ↵L Wang, B Spira, Z Zhou, L Feng, RP Maharjan, X Li, F Li, C McKenzie, PR Reeves, T Ferenci. 2010. Divergence involving global regulatory gene mutations in an Escherichia coli population evolving under phosphate limitation. Genome Biol Evol 2: 478–487.
- ↵MV Weinberg, GJ Schut, S Brehm, S Datta, MW Adams. 2005. Cold shock of a hyperthermophilic archaeon: Pyrococcus furiosus exhibits multiple responses to a suboptimal growth temperature with a key role for membrane-bound glycoproteins. J Bacteriol 187: 336–348.
- ↵E Williams, TM Lowe, J Savas, J DiRuggiero. 2007. Microarray analysis of the hyperthermophilic archaeon Pyrococcus furiosus exposed to gamma irradiation. Extremophiles 11: 19–29.
- ↵YI Wolf, IB Rogozin, AS Kondrashov, EV Koonin. 2001. Genome alignment, evolution of prokaryotic genome organization, and prediction of gene function using genomic context. Genome Res 11: 356–372.
- ↵GA Wray. 2007. The evolutionary significance of cis-regulatory mutations. Nat Rev Genet 8: 206–216.
- ↵O Wurtzel, R Sapra, F Chen, Y Zhu, BA Simmons, R Sorek. 2010. A single-base resolution map of an archaeal transcriptome. Genome Res 20: 133–141.
- ↵Q Xia, T Wang, EL Hendrickson, TJ Lie, M Hackett, JA Leigh. 2009. Quantitative proteomics of nutrient limitation in the hydrogenotrophic methanogen Methanococcus maripaludis. BMC Microbiol 9: 149. doi: 10.1186/1471-2180-9-149.
- ↵C Yanofsky. 1967. Gene structure and protein structure. Harvey Lect 61: 145–168.
- ↵SH Yoon, CG Hur, HY Kang, YH Kim, TK Oh, JF Kim. 2005. A computational approach for identifying pathogenicity islands in prokaryotic genomes. BMC Bioinformatics 6: 184. doi: 10.1186/1471-2105-6-184.
- ↵MA Zago, PP Dennis, AD Omer. 2005. The expanding world of small RNAs in the hyperthermophilic archaeon Sulfolobus solfataricus. Mol Microbiol 55: 1812–1828.
Notes
[1] [Supplemental material is available for this article.]
[2] Article published online before print. Article, supplemental material, and publication date are at http://www.genome.org/cgi/doi/10.1101/gr.122218.111.