
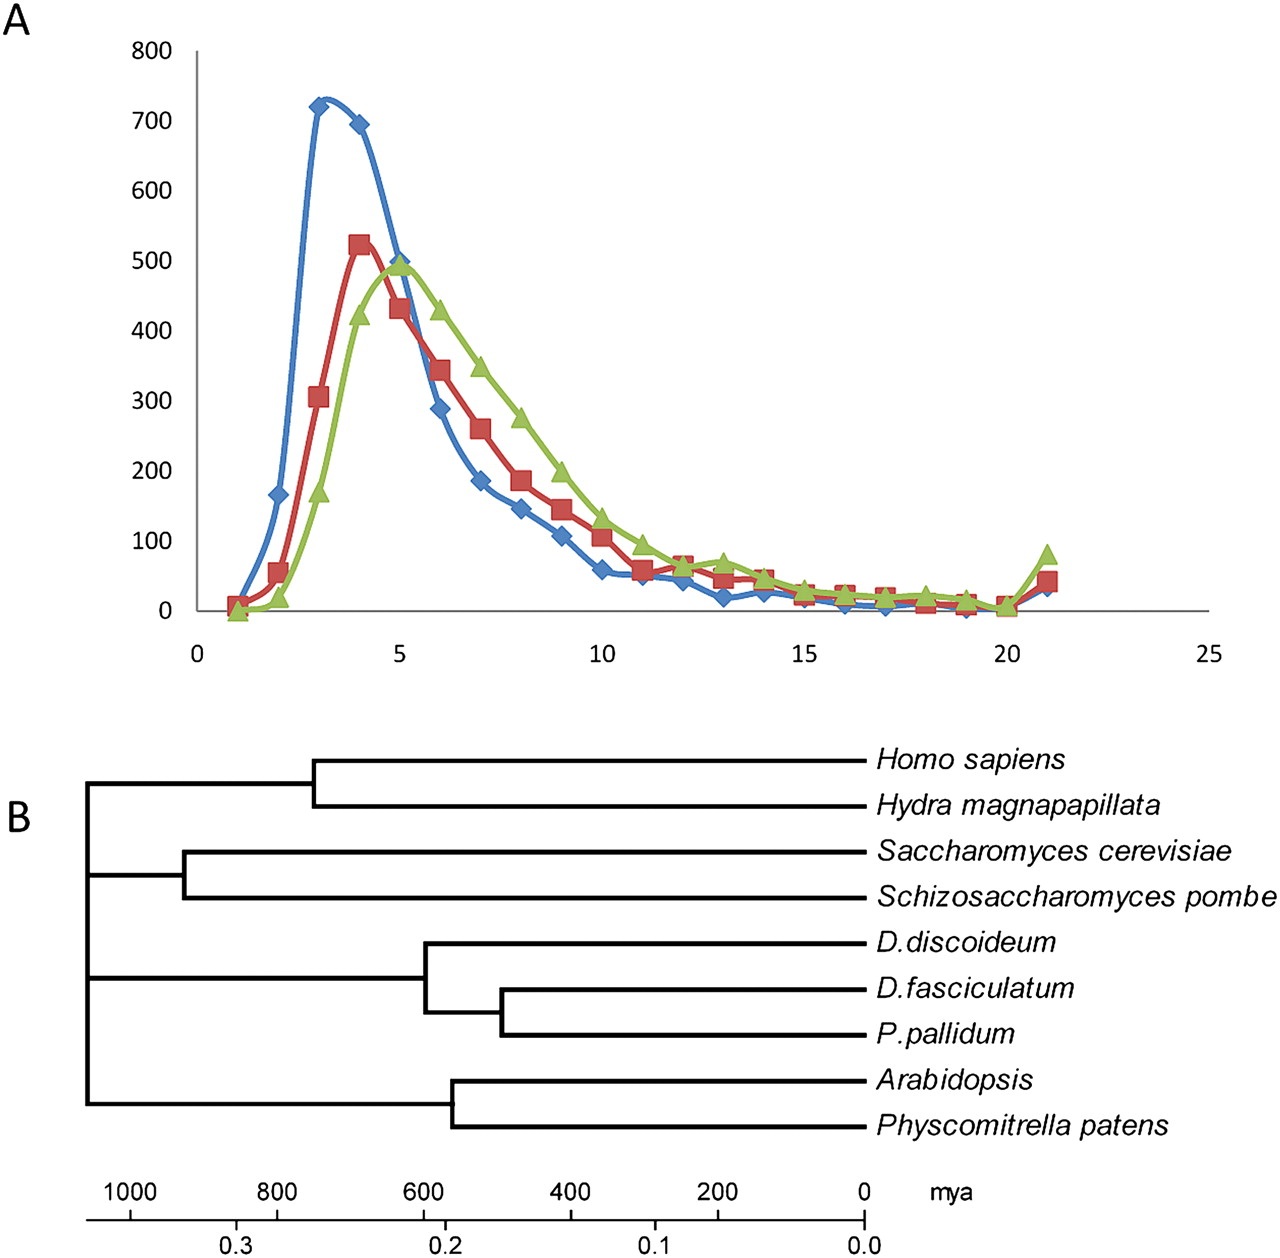
(A) Ratio (dS/dN) of scaled synonymous (dS) to scaled nonsynynonymous (dN) base substitutions between species pairs. The summed number of proteins with a given value of dS/dN ratios is shown. Only true orthologs with a minimum sequence identity of 40% over at least 50% of the gene length were used for calculation. Protein pairs with a dS of 0 are omitted. (Blue) DD/DF species pair; (red) DD/PP species pair; (green) DF/PP species pair. (B) Calibrated phylogenetic tree of major eukaryote lineages. A concatenated data set of 33 orthologous genes (Supplemental Table S6.1) was aligned using ClustalW. A neighbor-joining tree was reconstructed with MEGA4 (Pairwise gap deletion, Poisson correction, bootstrap test with 1000 replicates). The scale was calibrated using an estimated divergence time of 750 mya for the human/hydra split. The sequence of early evolutionary events cannot be resolved with this data set. A similar scale was obtained by using the moss/vascular plant split at 550 mya.


