
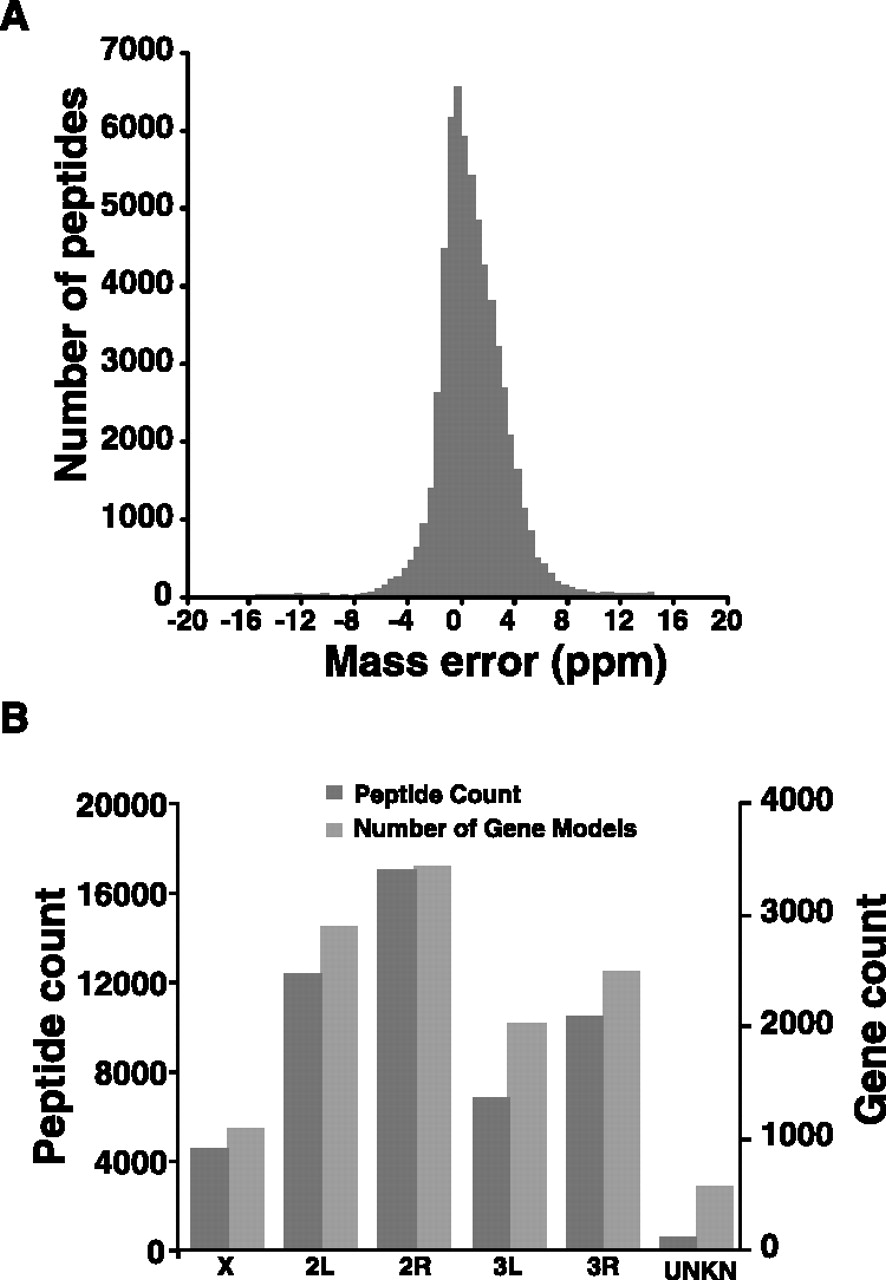
Figure 3.
Overview of mass spectrometry data used for genome annotation. (A) An estimation of the mass error of peptides in parts per million identified from mass spectrometric analysis of An. gambiae. (B) Chromosomal distribution of peptides identified by mass spectrometry. The number of peptides identified from each chromosome roughly parallels the estimated number of known and novel protein-coding genes in An. gambiae.


