
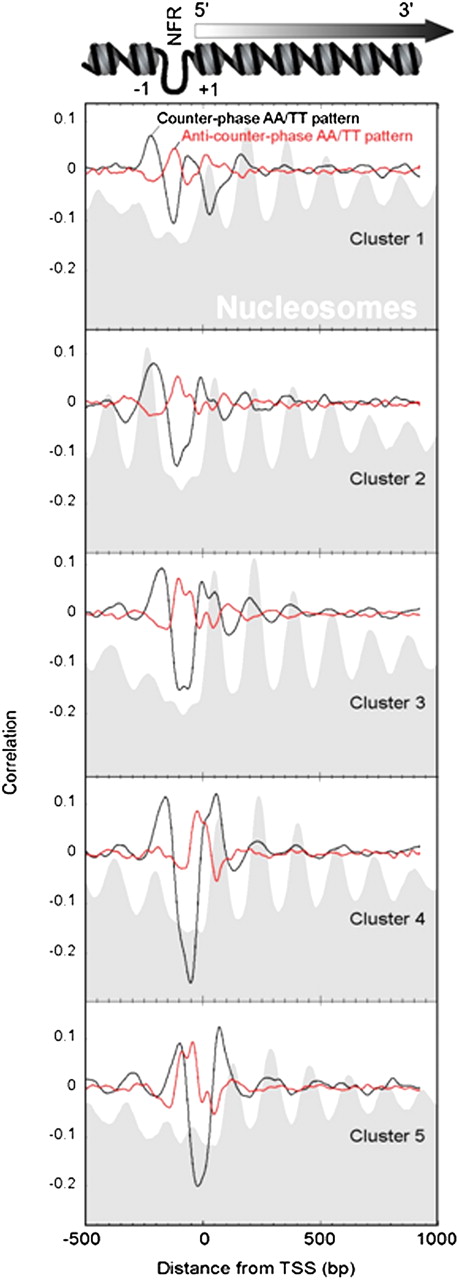
Figure 8.
Counter-phase AA/TT NPS and anti-NPS correlations predict subsets of nucleosome locations. Regular (black trace) and anti- (red trace) counter-phase AA/TT correlations are shown for composite subsets of nucleosomes defined by K-means clustering (from −500 to +1000 bp) of in vivo patterns for genes aligned by their TSS (Zhang et al. 2011). The gray-filled background shows the composite nucleosome distribution for each cluster of genes.


