
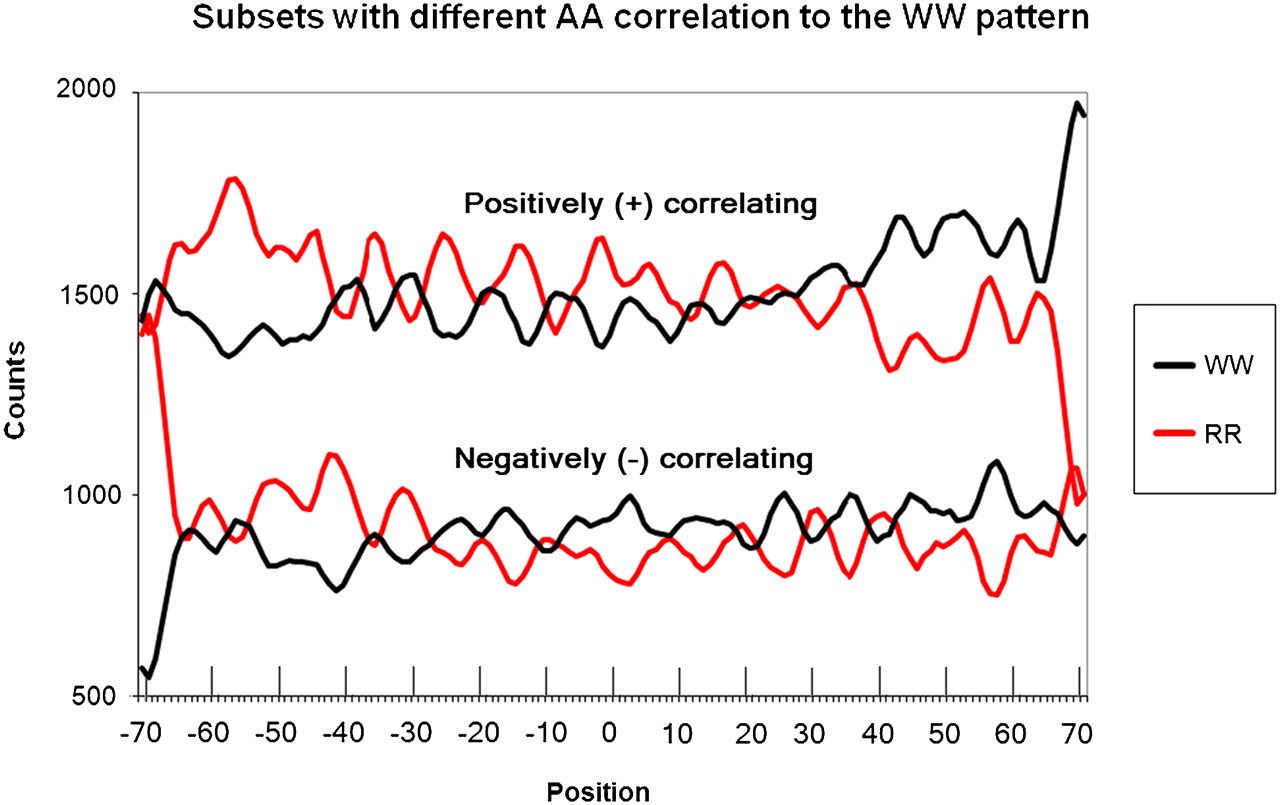
Figure 5.
Combined dinucleotide distributions (smoothed by 3 points) for subsets with AAs positively correlating with the major WW pattern from Albert et al. (2007) (+, higher in the graph) and with AAs negatively correlating with the major WW pattern (−, lower in the graph).


