
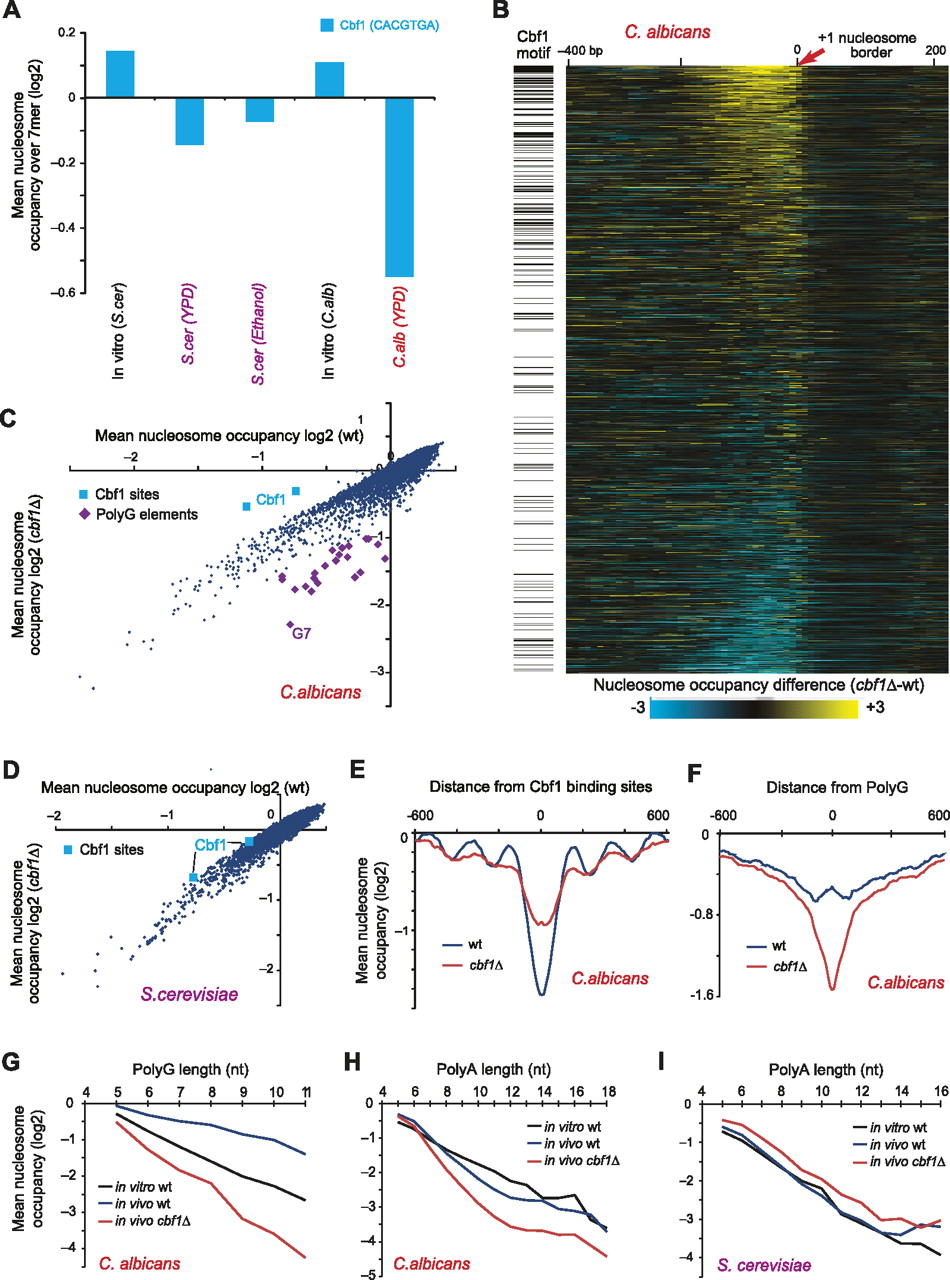
Cbf1 acts as a GRF in C. albicans. (A) Nucleosome depletion at the Cbf1 binding site in C. albicans is not a result of respiratory growth or genomic organization. Mean nucleosome occupancy at Cbf1 sites (y-axis) is shown for the indicated conditions (Kaplan et al. 2008; Field et al. 2009) and species. (B) Cbf1 deletion in C. albicans increases nucleosome occupancy at Cbf1 motifs. (Left) Genes with significant matches to the Cbf1-binding site (black). (Right) Difference in nucleosome abundance at each gene in C. albicans (rows) between cbf1Δ and wild-type strains. Genes are aligned by the +1 nucleosome/NFR boundary (0, red arrow) and ranked from gain (top, yellow) to loss (bottom, blue) in nucleosome occupancy over their NFR. (C) Cbf1-binding sites are the only 7-mers with increased mean nucleosome occupancy in C. albicans cbf1Δ strains compared with wild type. Shown is the mean nucleosome occupancy (log2) for each 7-mer in the wild-type (x-axis) and the cbf1Δ strain (y-axis). Cbf1 binding sites are indicated as blue squares, poly(G) sequences as purple diamonds. (D) As in C, but for S. cerevisiae. (E) Increased nucleosome occupancy in CACGTGA Cbf1 sites in C. albicans in the cbf1Δ strain. Shown is the average log2 nucleosome occupancy (y-axis) at all genes with a CACGTGA Cbf1 motif match in their promoter in wild-type (blue) and cbf1Δ (red) strains. Genes are aligned by the location of the CACGTGA Cbf1 motif (position 0 on the x-axis). (F) Poly(G) sequences are more nucleosome depleted in a cbf1Δ strain. Shown are average nucleosome occupancy values (y-axis) centered on all poly(G) elements of strength of 2 or greater (0 on the x-axis) for cbf1Δ (red) and wild-type (blue) strains in C. albicans. (G–I) Cbf1 deletion affects nucleosome occupancy in vivo at intrinsic poly(G) and poly(A) sequences in C. albicans, but not in S. cerevisiae. Shown are mean nucleosome occupancy levels (log2, y-axis) for poly(G) (G) and poly(A) (H,I) sequences of different length (x-axis) in C. albicans (G,H) and S. cerevisiae (I) for wild-type (blue), in vitro (black), and cbf1Δ (red) experiments.


