
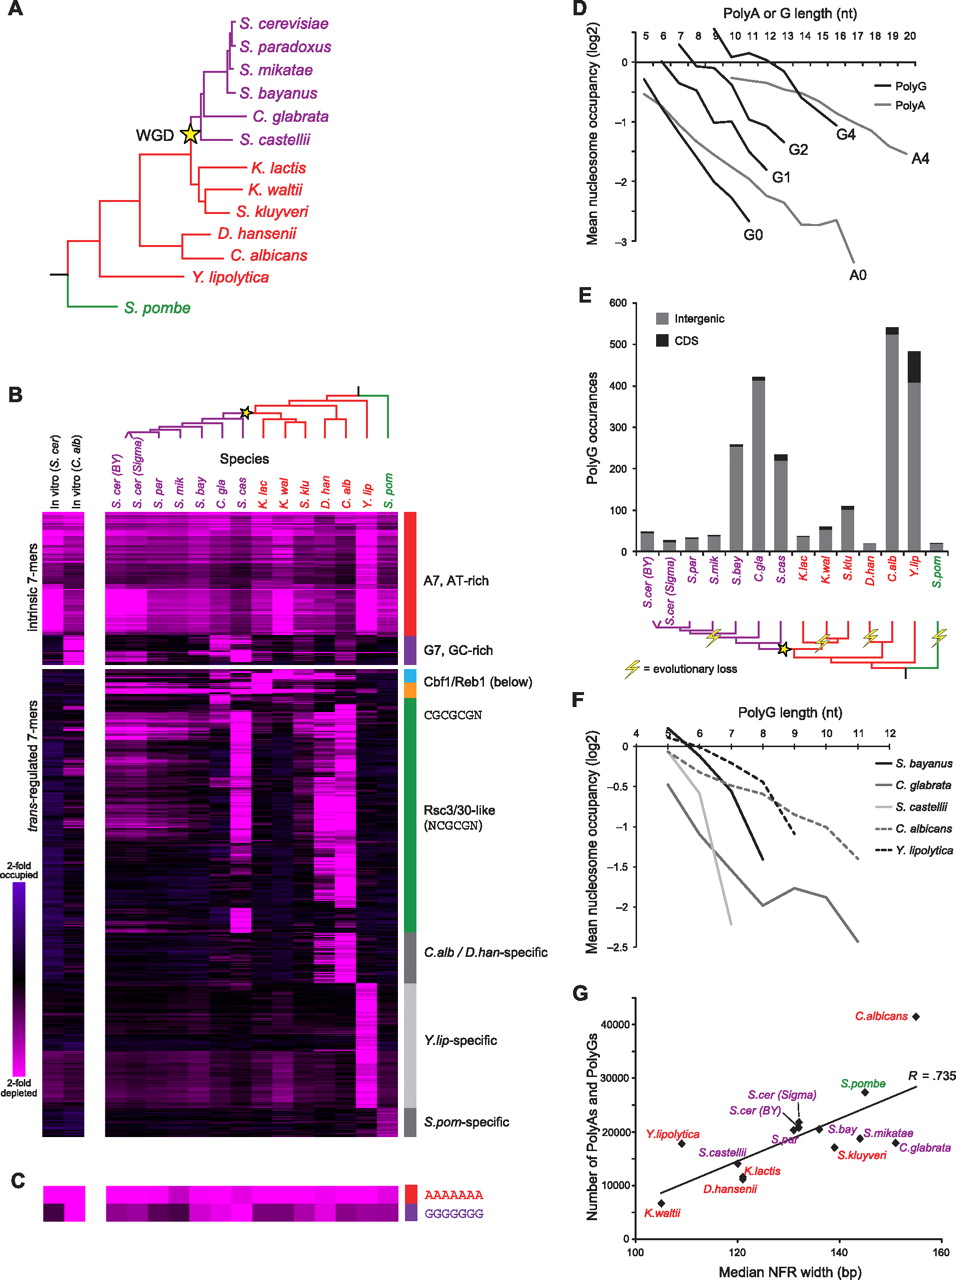
PolyG is an instrinsic antinucleosomal sequence element. (A) Phylogeny of species included in this study (adapted from Wapinski et al. 2007). Whole-genome duplication (WGD) event is marked by the yellow star. Species names are colored to denote major phylogenetic groups. (B) Nucleosome occupancy over 7-mers. All 7-mer sequences (rows) with mean log2 occupancy <−0.75 (there are no 7-mers with occupancy >0.75) in at least one species (columns) are shown across all species for in vivo data (righthand 14 columns) (Tsankov et al. 2010; Weiner et al. 2010) and for in vitro reconstitution experiments (lefthand two columns) (Kaplan et al. 2008; Field et al. 2009). Sequences are clustered by their nucleosome occupancy profiles and specific clusters are marked on right. (Pink) depleted; (violet) occupied. (C) Data for 7-mers AAAAAAA and GGGGGGG, as in B. (D) poly(G) sequences affect nucleosome depletion in vitro in a similar manner to poly(A) sequences. Shown is the average log2 nucleosome occupancy (y-axis) from in vitro reconstitution of C. albicans genomic DNA (Field et al. 2009) for poly(A) and poly(G) sequences of various lengths (x-axis). Ai (Gi) refers to poly(A) [poly(G)] sequences with i mismatches (e.g., A0, no mismatches; A4, four mismatches). (E) Abundance and locations of poly(G) sequences in each species. (Top) Shown are values for sequences of strength 4 or greater (see Methods). (Gray) Positioned within intergenic region; (black) positioned within coding sequence (CDS). (Bottom) A phylogenetic reconstruction of evolutionary losses (lightning bolt) of abundance in poly(G) sequences along the phylogeny. (F) poly(G) elements are also nucleosome depleted in vivo in several yeast species. Shown are the mean in vivo log2 nucleosome occupancies (y-axis) for poly(G) sequences (no mismatches) of different lengths (x-axis) in several species. (G) Median NFR width in each species correlates with abundance of antinucleosomal tracts in its genome. Shown is the median NFR width (Tsankov et al. 2010) (x-axis) for each species (♦) vs. the total number of poly(A) and poly(G) sequences of strength 2 or greater in that species (y-axis). Line represents the best linear fit. Species names are colored as in A.


