
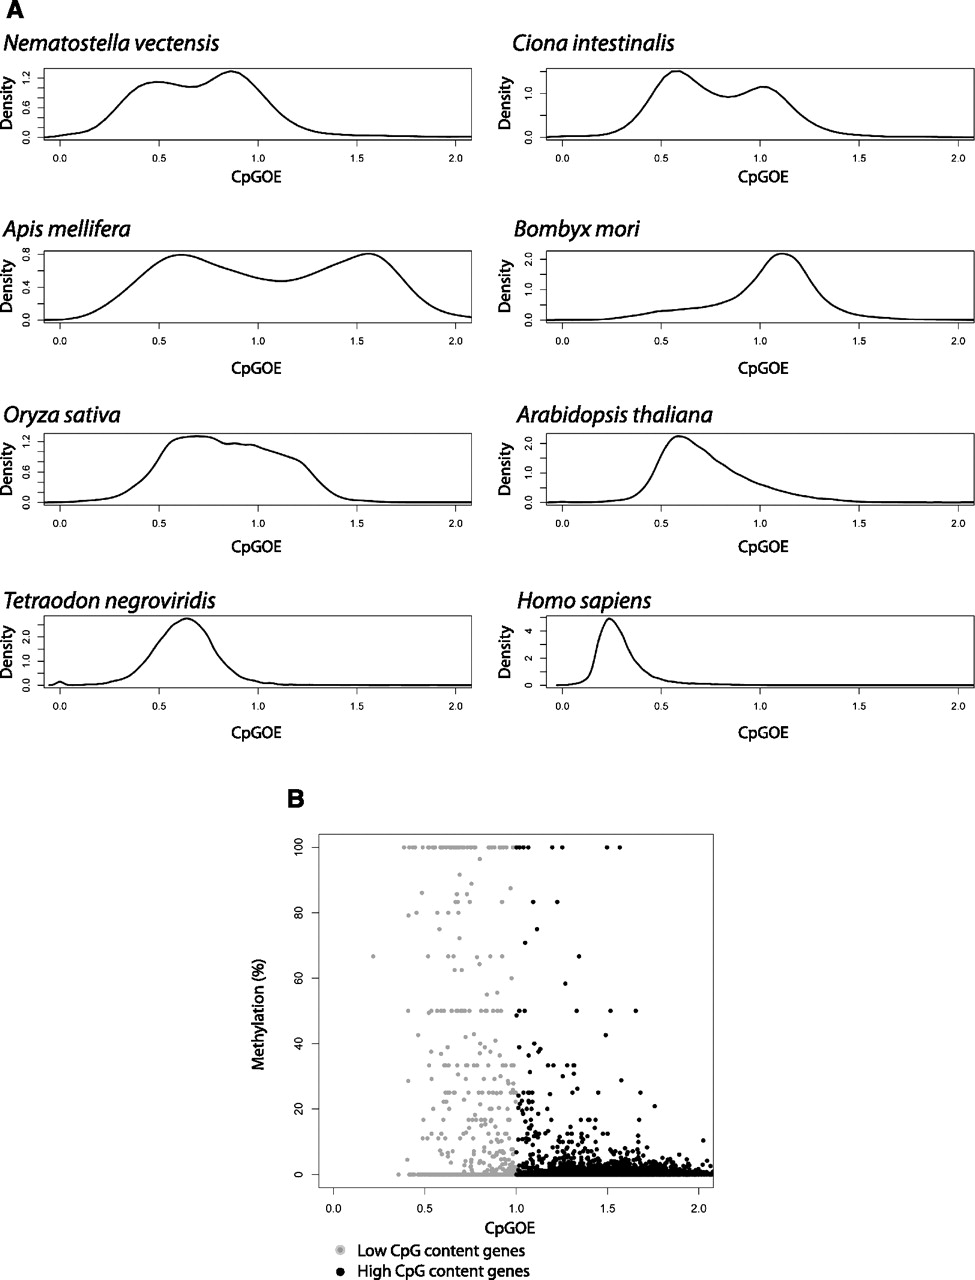
Gene-body CpG content and methylation in various eukaryotic species. (A) CpGo/e ratio distribution kernel density estimates for gene bodies for different eukaryotic genomes. Gene bodies were defined as the sequence between the transcriptional start and termination sites annotated in the latest genome build for each species (see Methods). (B) We generated RRB-seq data for A. mellifera mature spermatozoa (from a pool of six drones). Average gene-body CpGo/e and DNA methylation levels were calculated for each gene (see Methods). Plotted are 933 low-CpG genes (light gray) and 4537 high-CpG genes (dark gray). Please also refer to Supplemental Figure S1 in which the similar plots are shown but using only those genes for which we had data from at least three CpG sites (with similar conclusions).


