
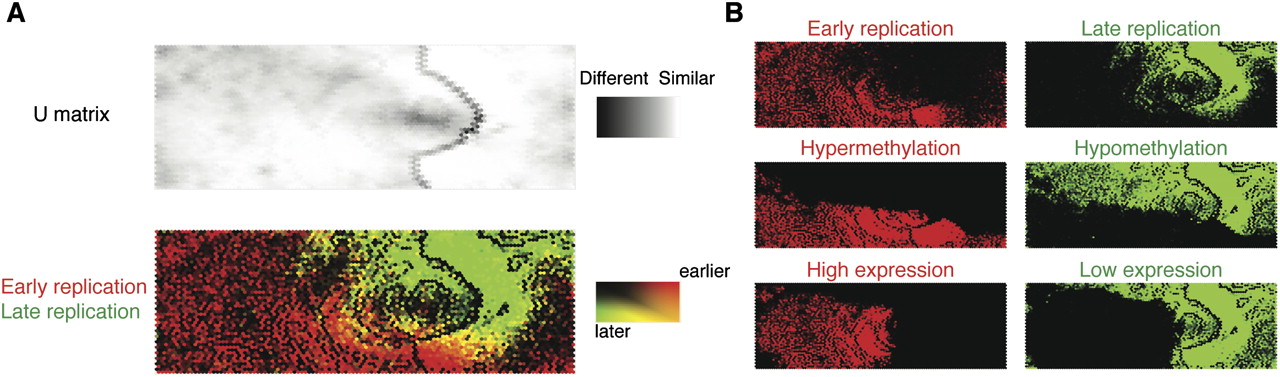
A self-organizing map analysis correlates DNA replication with methylation and transcription patterns. In this self-organizing map (SOM) representation of the multivariate data set, the top panel shows a U matrix representation of the map derived from genome-wide DNA methylation log2 ratios, RefSeq gene expression, RefSeq gene number, CpG island number, and HpaII-amplifiable fragment number in each 100-kb window. Each node is shaded using a linear grayscale that represents the mean Euclidean distance of that node vector relative to its immediate neighbors on the map ([white] most similar; [black] least similar). Overlaying loci with information about late (green) and early (red) replication shows that the parameters tested are predictive of replication timing, as evidenced by the clear separation of the red and green regions (A). We break out some of the variables used in generating the SOM (cytosine methylation, gene expression) to illustrate their overall correlations with DNA replication (B).


