
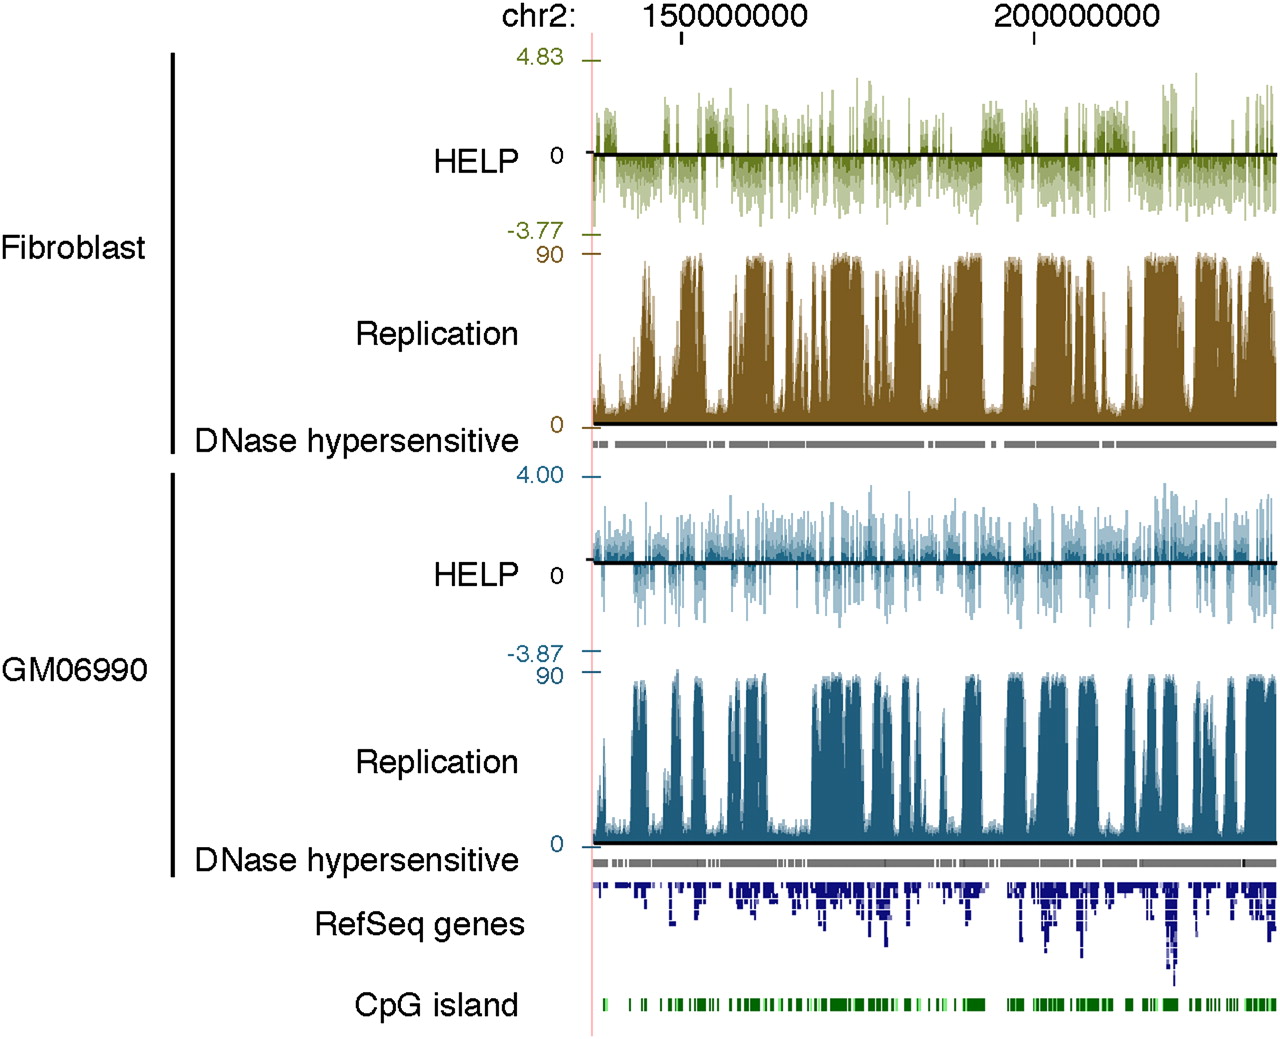
Figure 1.
Cytosine methylation and replication timing correlate in broad genomic regions. (Top) Fibroblast data; (bottom) GM06690 lymphoblastoid cell line data. Cytosine methylation is shown as the HpaII/MspI log2 intensity ratio from the HELP assay. Positive values indicate relative hypomethylation, and negative values indicate hypermethylation of HpaII sites. DNA replication timing data are generated from raw sequence reads by an arctangent transformation of 1-kb counts comparing early (G1 and S1) and late (S4 and G2) cell samples, as described in the Methods section. Earlier replicated regions have higher values than later replicated regions.


