
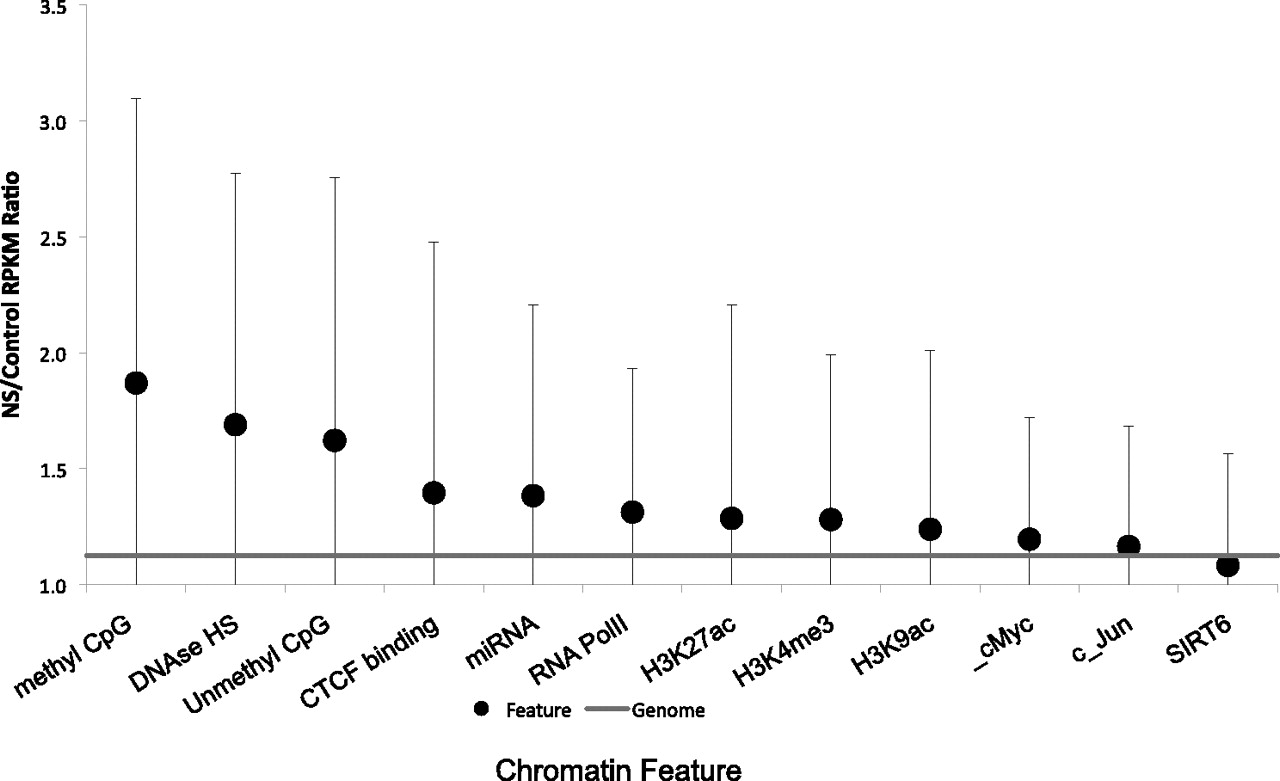
Chromatin modifications and replication initiation events. The average nascent strand versus genomic DNA ratio (calculated as described for Fig. 2) is shown for genomic regions that contain the indicated chromatin modification features. Modified regions were identified using data from the UCSC Genome Browser (Table 3). Mean NS/control RPKM ratios (dot), and corresponding SDs (error bars), are shown. The horizontal line indicates a matched random control. Chromatin modification features are sorted according to the level of enrichment for replication initiation frequency. Statistically significant deviations from replication ratios of the entire genome (P < 0.001) were observed for all modifications except c-Jun and SIRT6. For intersections between chromatin features (regions that exhibit combinations of chromatin modifications), please see Supplemental Information.


