
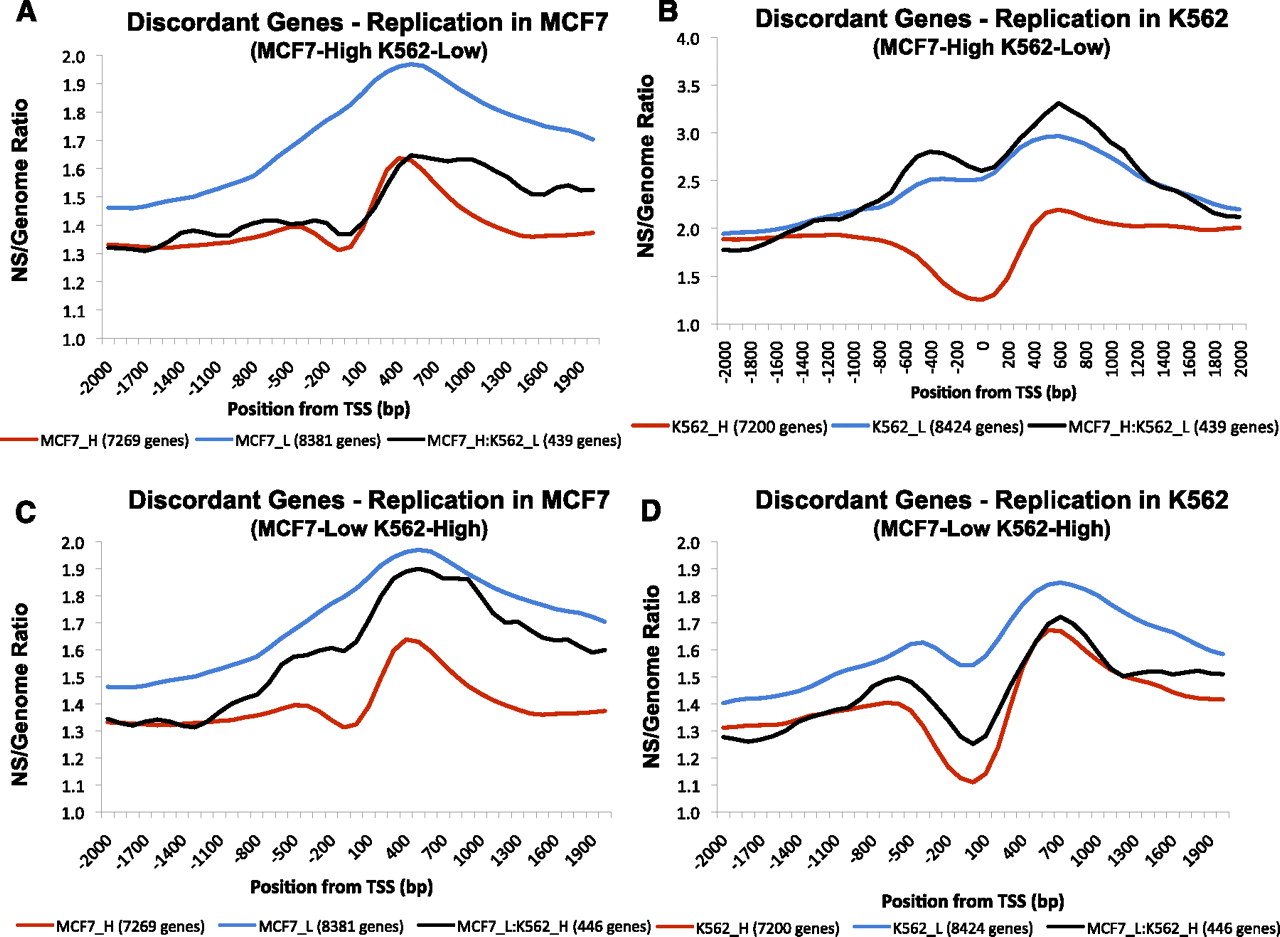
Replication initiation in discordantly expressed genes. We calculated replication enrichment ratios (nascent strands RPKM vs. control genomic DNA RPKM) for genes whose level of expression differed significantly between K562 and MCF7 cell types. Genes with log2 GCRMA values <4.3 in MCF7 and >6.3 in K562 were considered MCF7-low and K562-high (MCF7_L:K562_H); genes with log2 GCRMA values <4.3 in K562 and >6.3 in MCF7 were considered MCF7-high and K562-low (MCF7_H:K562_L). (A) Distribution of nascent strand enrichment ratios in MCF7 cells for MCF7_H:K562_L genes. For comparison, enrichment ratio plots for MCF7_H and MCF7_L genes are shown. (B) Distribution of enrichment ratios in K562 cells for MCF7_H:K562_L genes. For comparison, enrichment ratio plots for K562_H and K562_L genes are shown. (C) Distribution of nascent strand enrichment ratios in MCF7 cells for MCF7_L:K562_H genes. For comparison, enrichment ratio plots for MCF7_H and MCF7_L genes are shown. (D) Distribution of enrichment ratios in K562 cells for MCF7_L:K562_H genes. For comparison, enrichment ratio plots for K562_H and K562_L genes are shown.


