
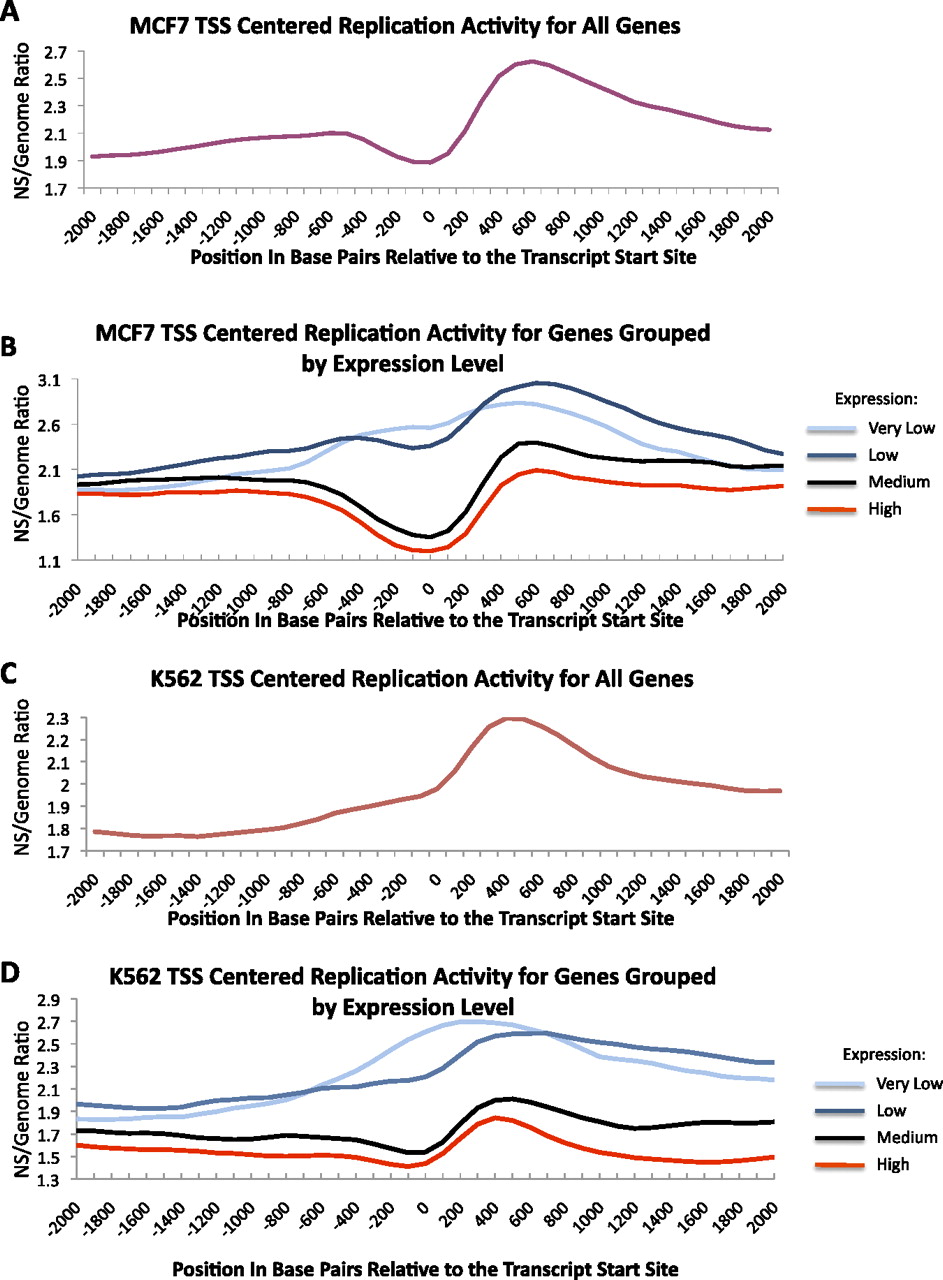
Figure 3.
Replication initiation depletion at the transcription start site (TSS) in transcribed genes. (A) Average replication enrichment ratio in MCF7 cells (calculated as in Fig. 2) plotted against distance from the TSS for all known genes. (B) Distribution of replication enrichment ratios in MCF7 cells for groups of genes that exhibit different levels of expression. Levels include the following: very low (log2 GCRMA <2.3), low (log2 GCRMA 2.3–5.3), medium (log2 GCRMA 5.3–8.5), and high (log2 GCRMA >8.5). (C,D) The same analyses are shown for K562 cells.


