
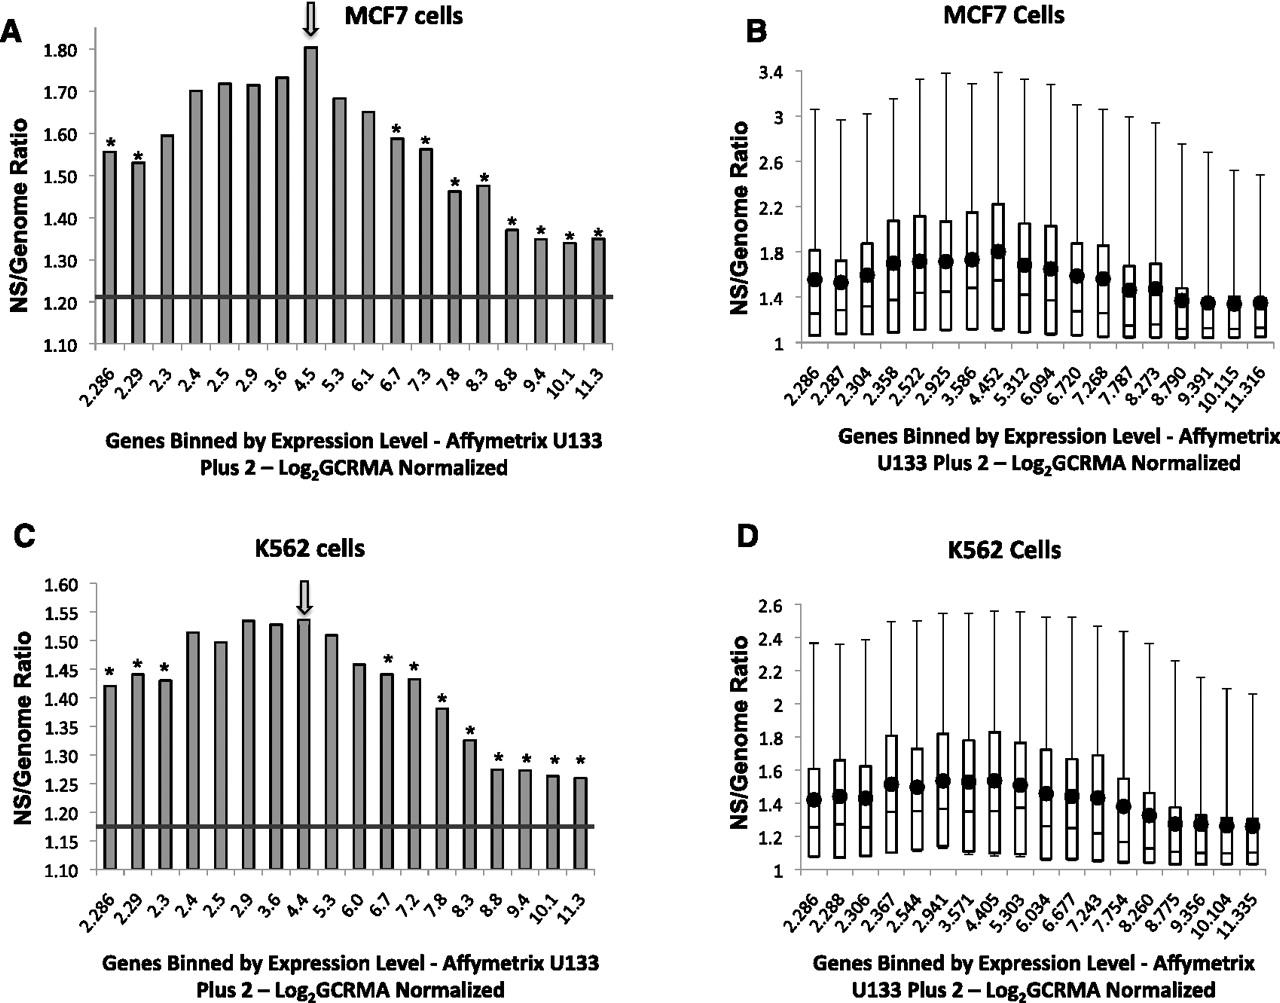
Replication and transcription. (A,B) Replication enrichment ratios (nascent strand [NS] versus genomic control RPKM) for all identified genes in MCF7 cells plotted against log2 GCRMA normalized gene expression. Genes on the x-axis were binned according to gene expression, with each bin containing 897 genes. The first column, however, represents a combination of the first five bins, which includes 4485 low-expressing genes that did not show significant differences in log2 GCRMA normalized gene expression. (A) The mean enrichment ratio for each bin is plotted against gene expression. (B) Replication enrichment ratios calculated as in A, showing the distribution of enrichment ratio values as a box plot. (C,D) Replication enrichment ratios calculated as in A and B for K562 cells plotted as a histogram of mean values (C) or as a box plot (D). For mean value histograms (A,C), asterisks represent statistically significant (P < 0.001) divergence from the central bin, which is marked with an arrow. For box plots (B,D), boxes indicate distributions of the second and third quartiles; dots indicate mean values; error bars indicate the fifth and 95th percentiles. The horizontal line in A and C represents the average enrichment ratio of the entire genome.


