
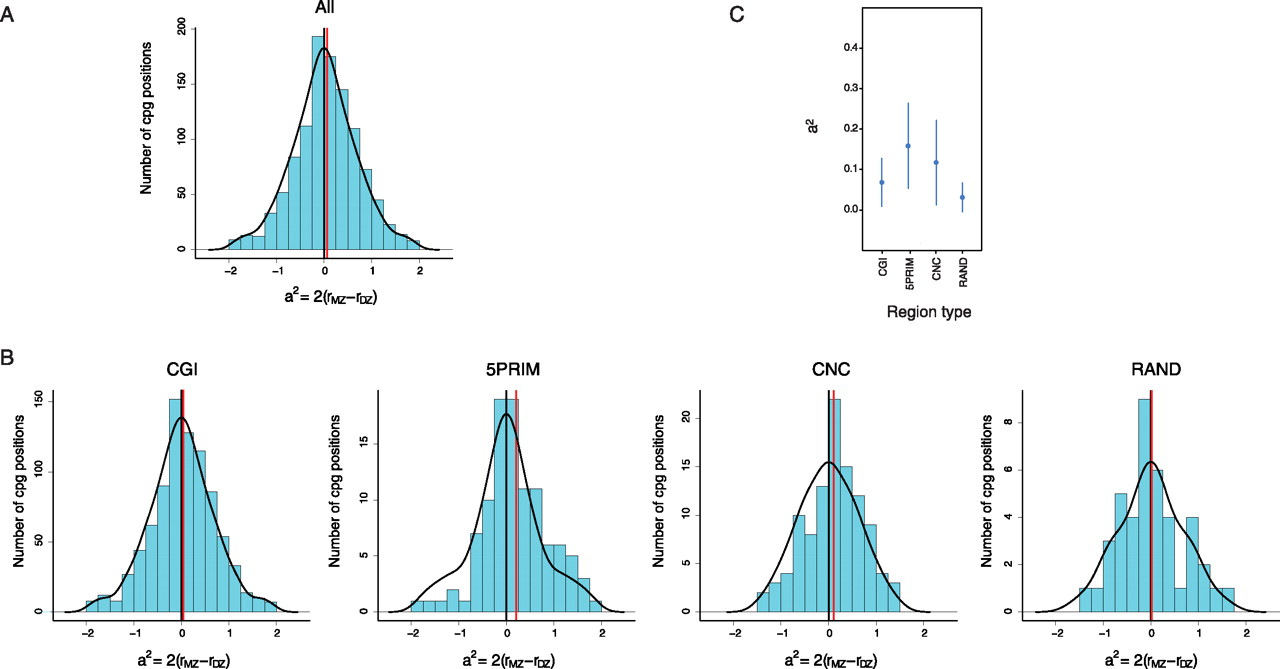
Figure 4.
Histograms showing twin pair correlation of DNA methylation in MZ versus DZ twin pairs. MZ correlation minus DZ correlation is computed separately in each of 1156 individual CpGs in 175 amplicons (nonvariable positions are removed) and shown overall (A) and in different region types (B). The superimposed density curve (in black) shows what it would look like if there were no differences between MZ and DZ pairs, i.e., if genes had no influence, only a common environment. (C) Plots of confidence intervals from the estimated heritabilities for the various sequences.


