
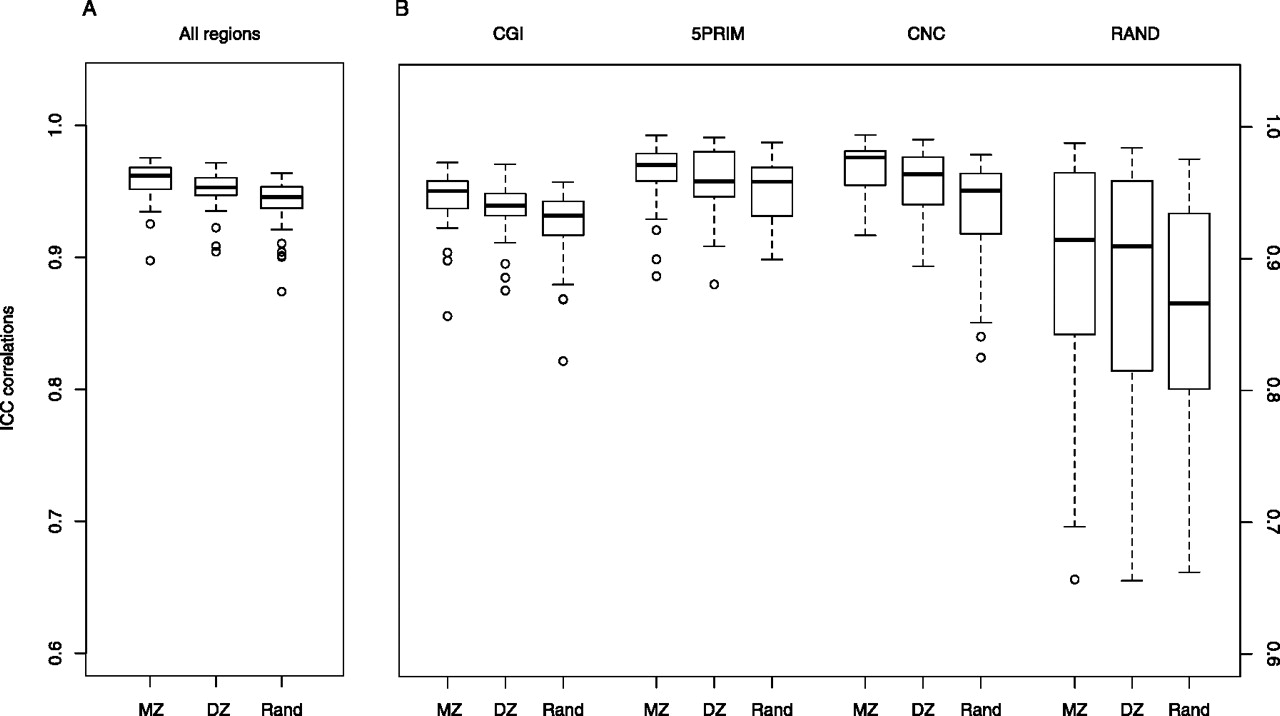
Figure 3.
Box plots displaying intra-class correlations of DNA methylation overall (A) and in the different region types (B) calculated for MZ, DZ, and RZ. The correlations are computed for each twin pair separately, as correlations between all methylation values over all amplicons and CpGs for that twin pair.


