
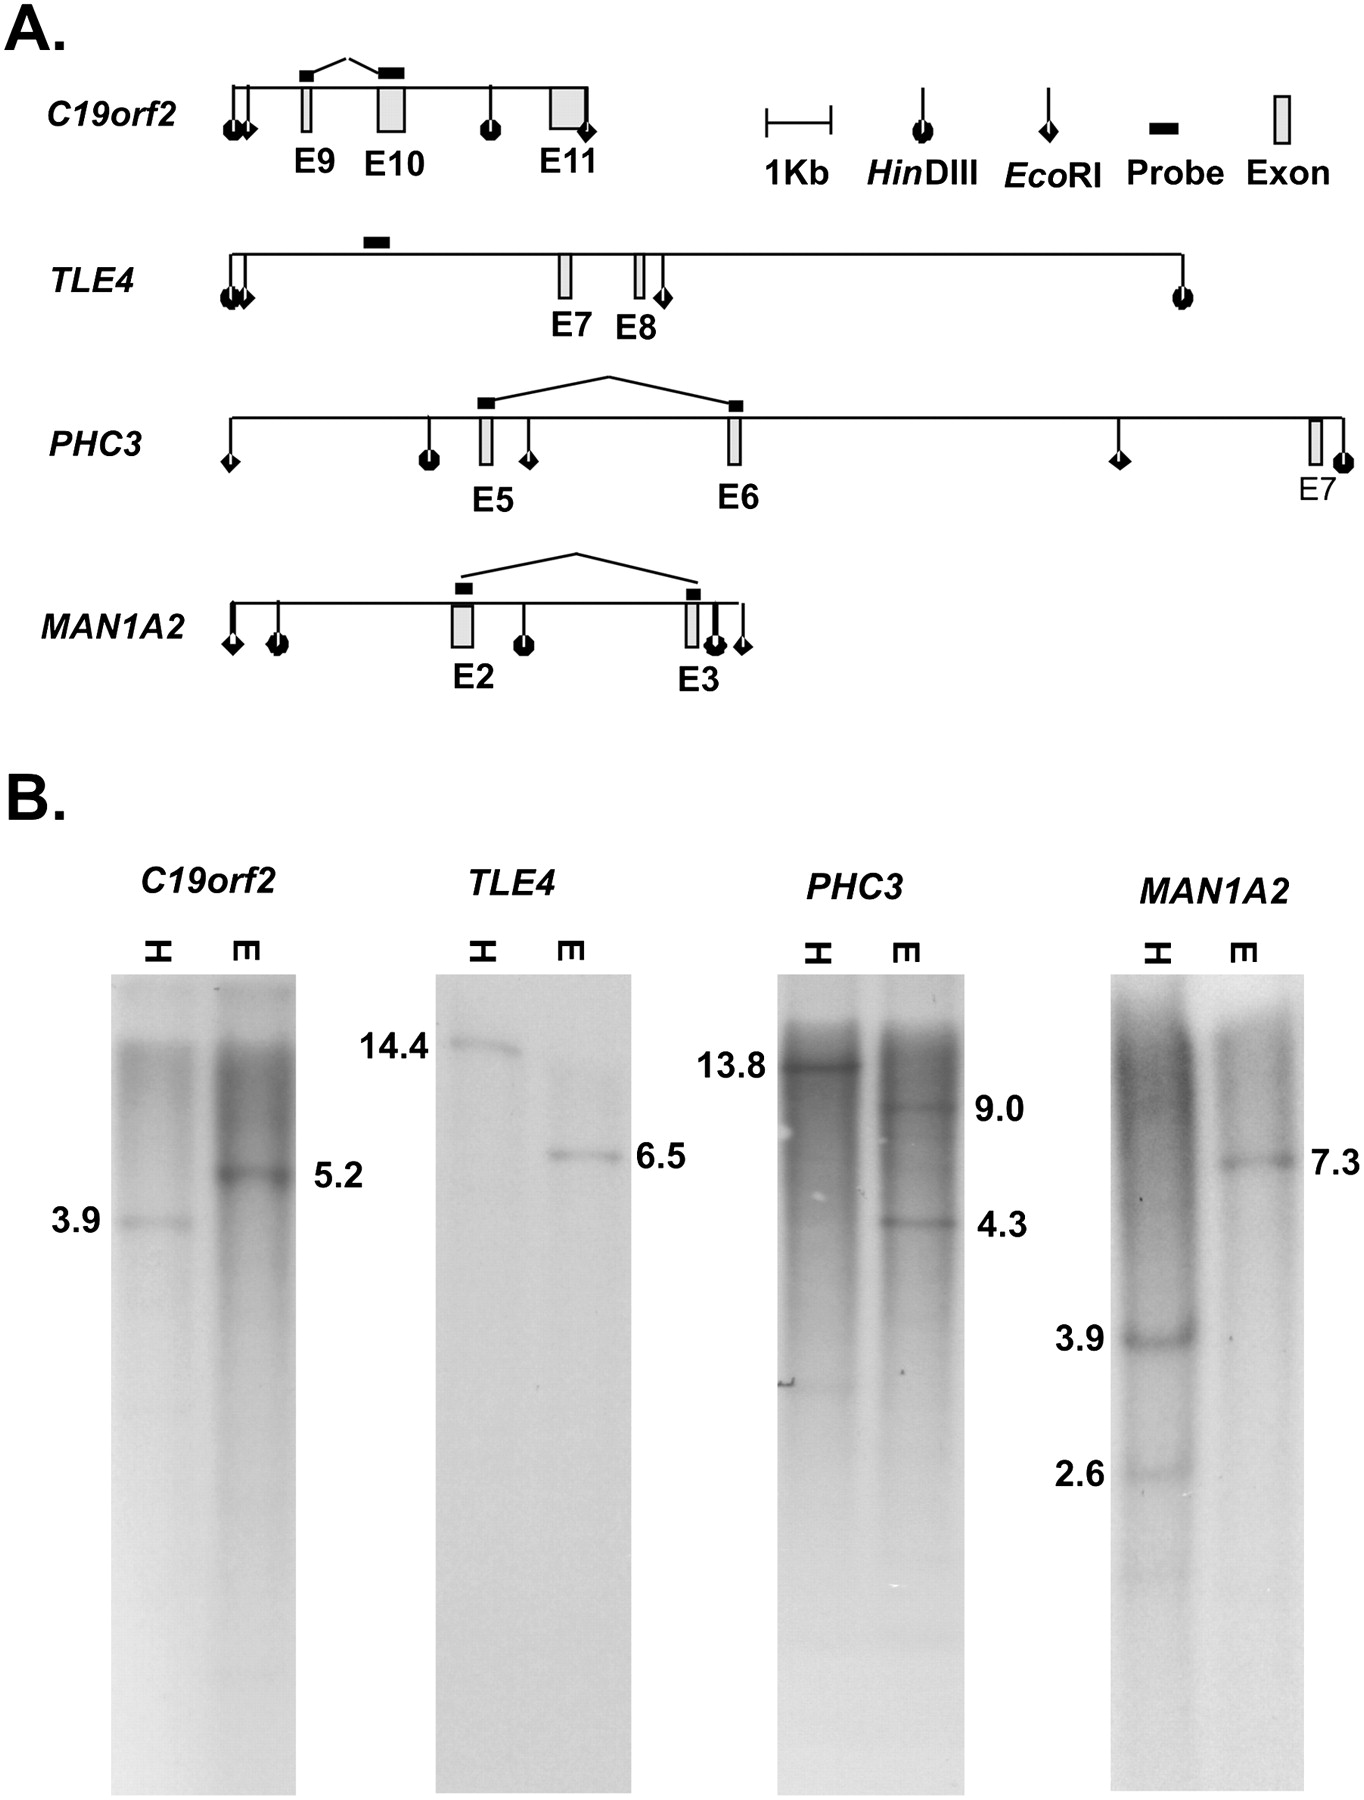
Figure 6.
Genomic Southern analysis of PTES exons. (A) Position of exons flanking PTES junctions in four genes relative to genomic HinDIII and EcoR1 sites (Build GRCh37/19). (B) Southern blots of human genomic DNA using the probe and enzyme combinations shown in A ([H] HinDIII; [E] EcoR1). The expected product sizes are shown in each case. For details, see Methods and Supplemental Table S6.


