
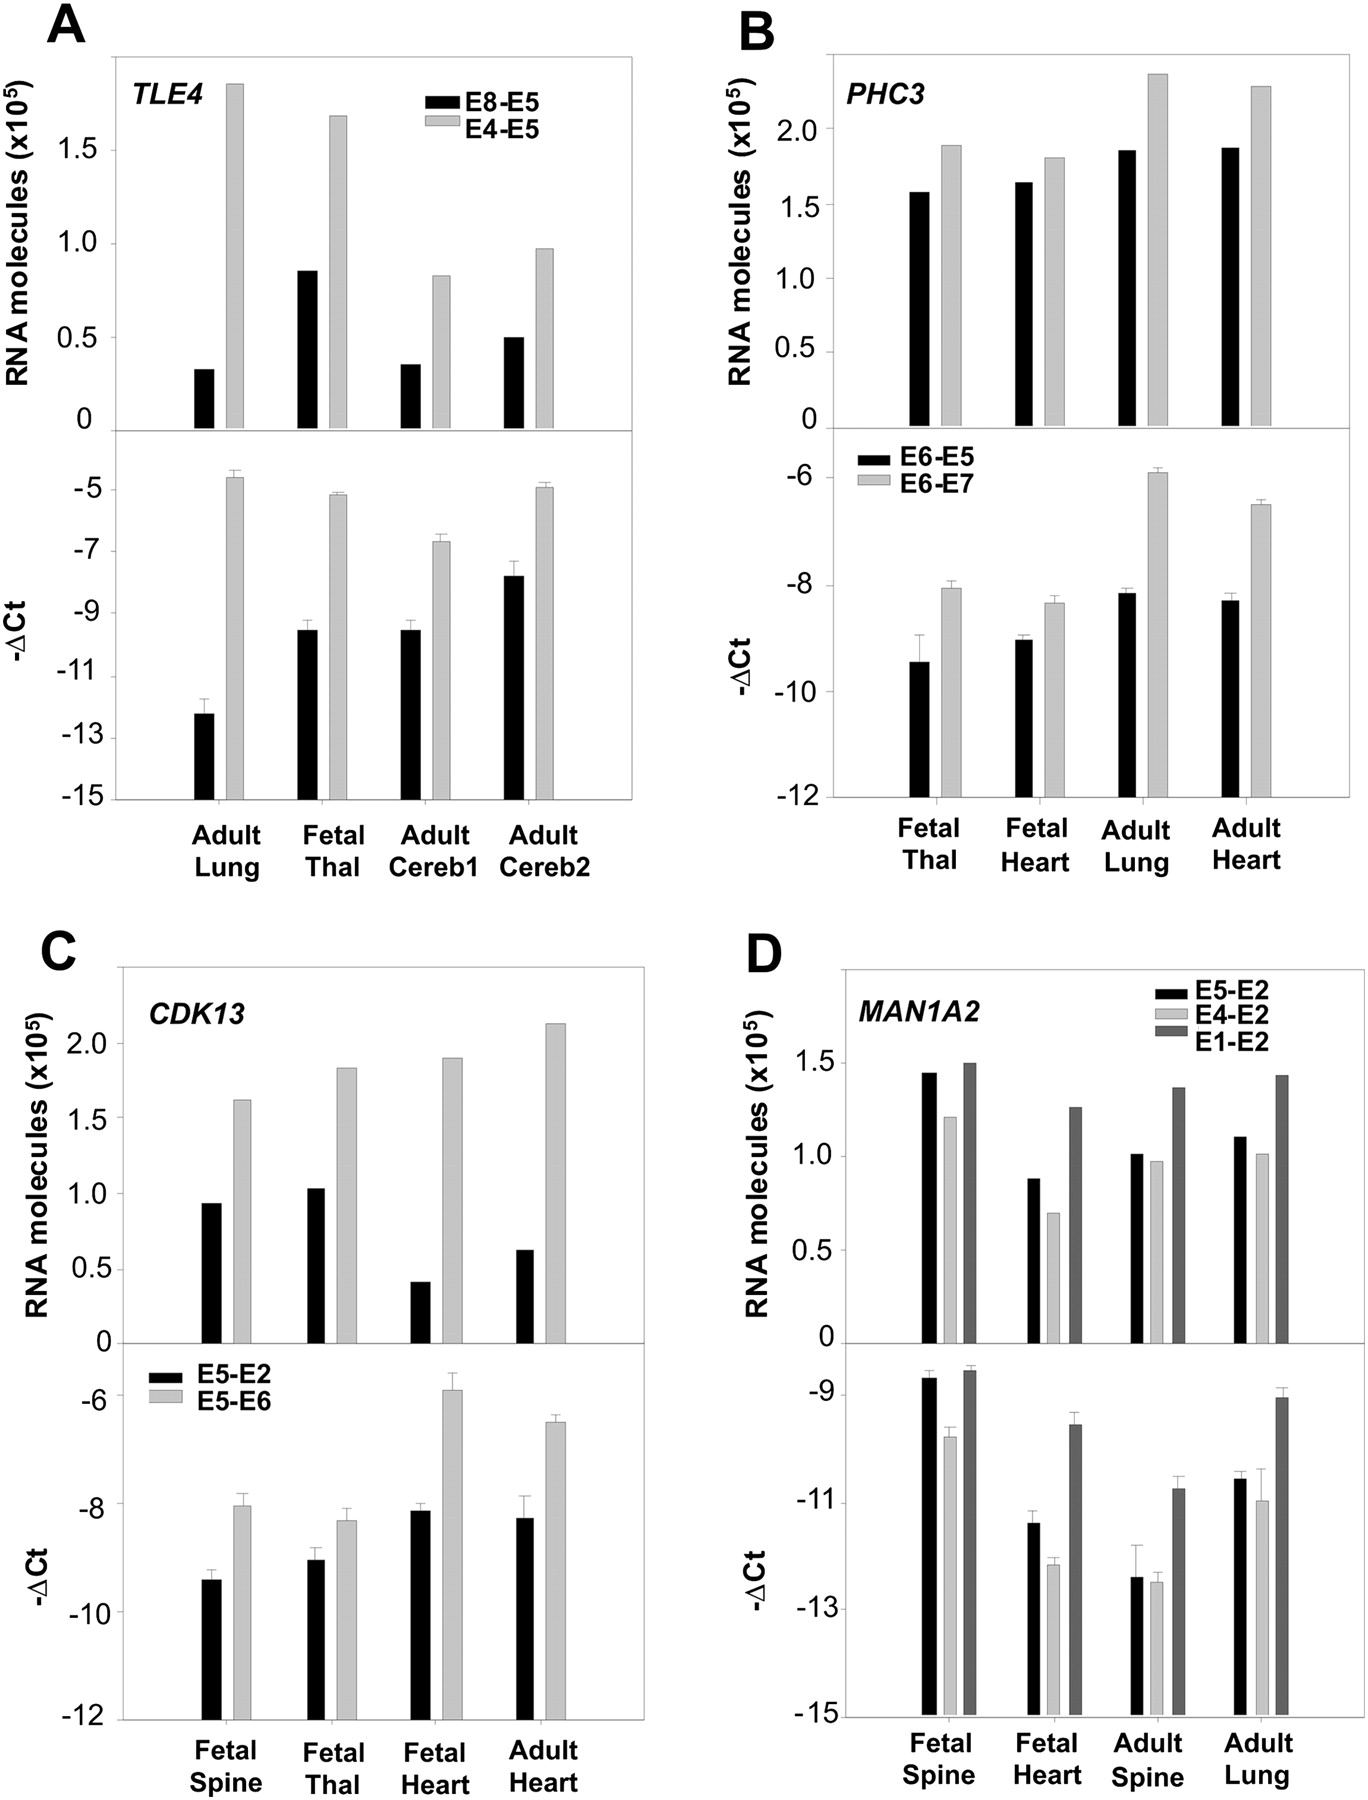
Figure 5.
Identification of abundant PTES products using real-time PCR. (A) TLE4; (B) PHC3; (C) CDK13; and (D) MAN1A2. Each panel shows PTES and canonical transcript abundance in four human tissues estimated using both standard curves (upper bars) and the Δ − Ct method (lower bars) As all genes are expressed at a lower level than control genes, −Δ − Ct values are plotted to facilitate comparison with data from standard curves. (Thal) Thalamus; (Cereb) cerebellum. Additional data are presented in Supplemental Figures S4 and S5. For all primers, see Supplemental Table S6.


