
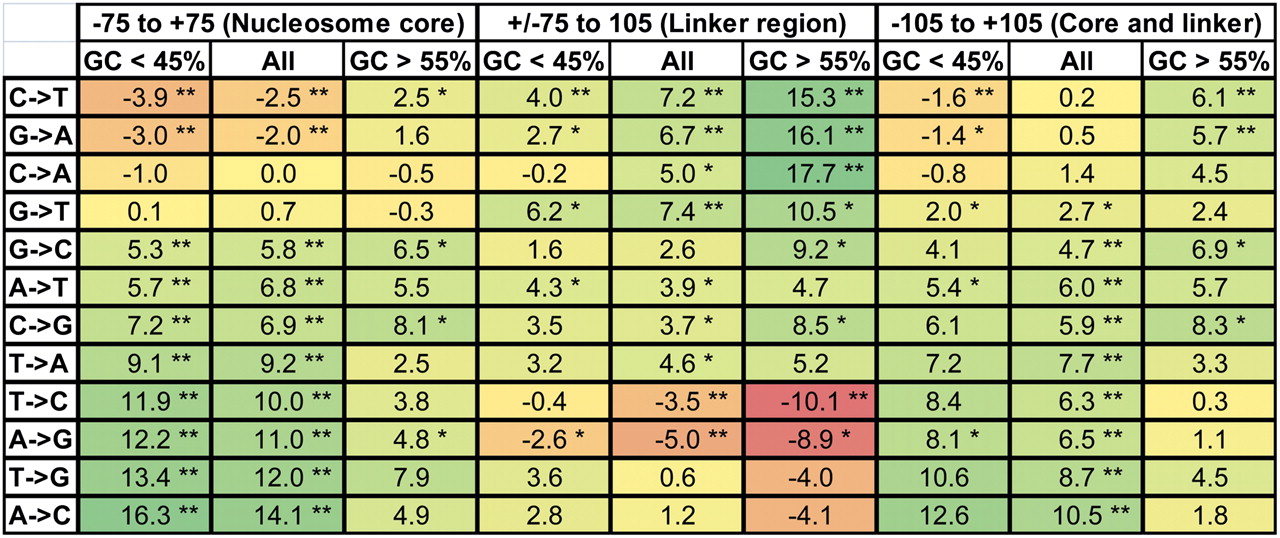
Figure 5.
Deviation of interspecies divergence rates from flanking rates in and around nucleosomes and at different flanking GC compositions. The percentage of enrichment (or depletion) of flanking corrected interspecies rates of changes with respect to corresponding observed rates of intraspecies change. Significantly elevated or depleted levels are indicated by * (uncorrected P-value of 0.05) and ** (uncorrected P-value of 0.00046, corrected P-value of 0.05). Nucleosome positioning data were derived from the Schones et al. (2008) data set.


