
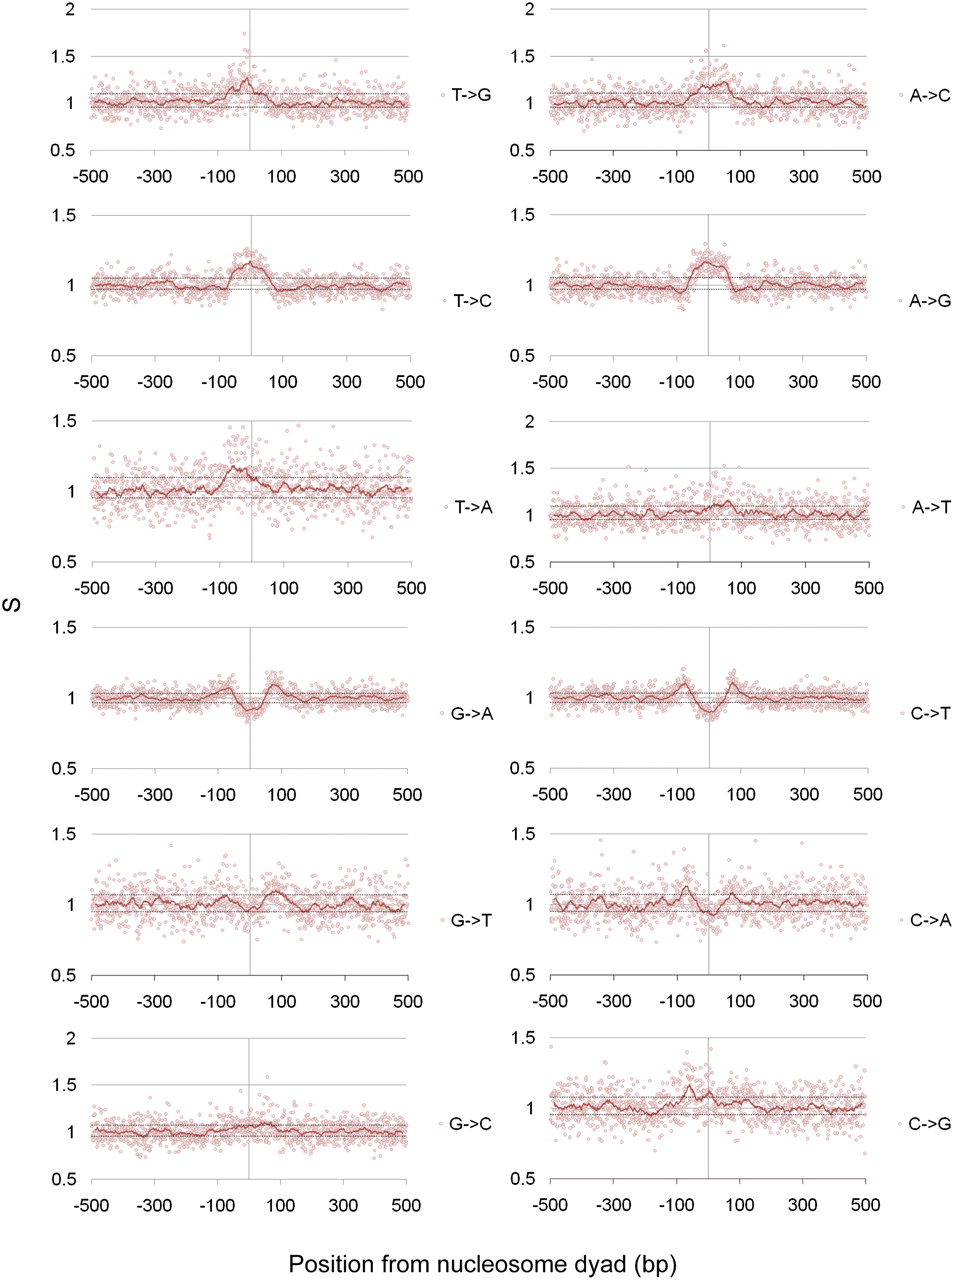
Figure 4.
Rates of selection in and around nucleosome dyads. Ratios of background corrected inter- and intraspecies divergence rates plotted against position from nucleosomal dyad (Sx→y scores). Dotted horizontal lines correspond to an uncorrected P-value of 0.004 (corrected P-value of 0.05). Nucleosome positioning data were derived from the Schones et al. (2008) data set.


