
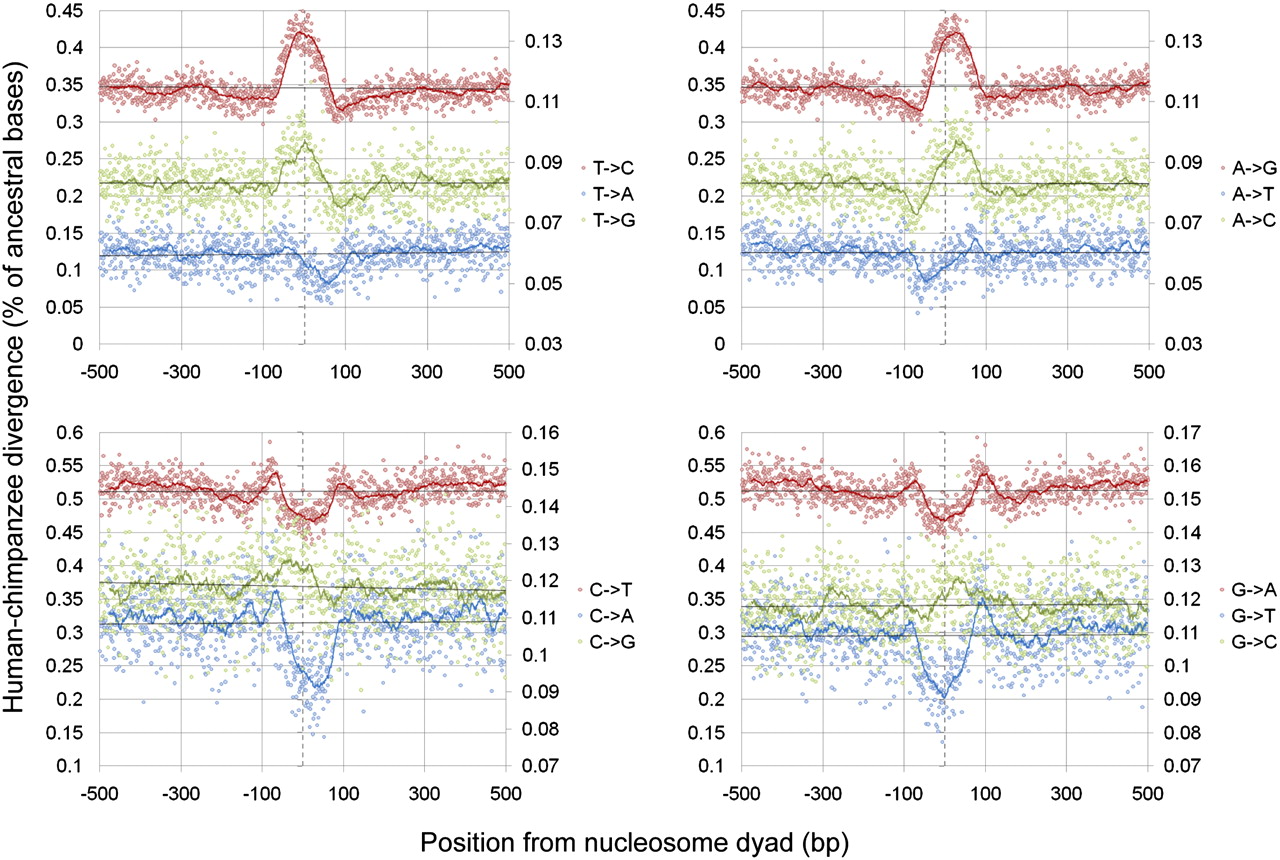
Figure 2.
Interspecies rates of divergence around nucleosome dyads in the human lineage. Colored solid lines correspond to 25-bp sliding averages. Dotted vertical lines represent the estimated dyad position. Transversions are plotted on the secondary y-axis due to their substantially lower rates. Nucleosome positioning data were derived from the Schones et al. (2008) data set.


