
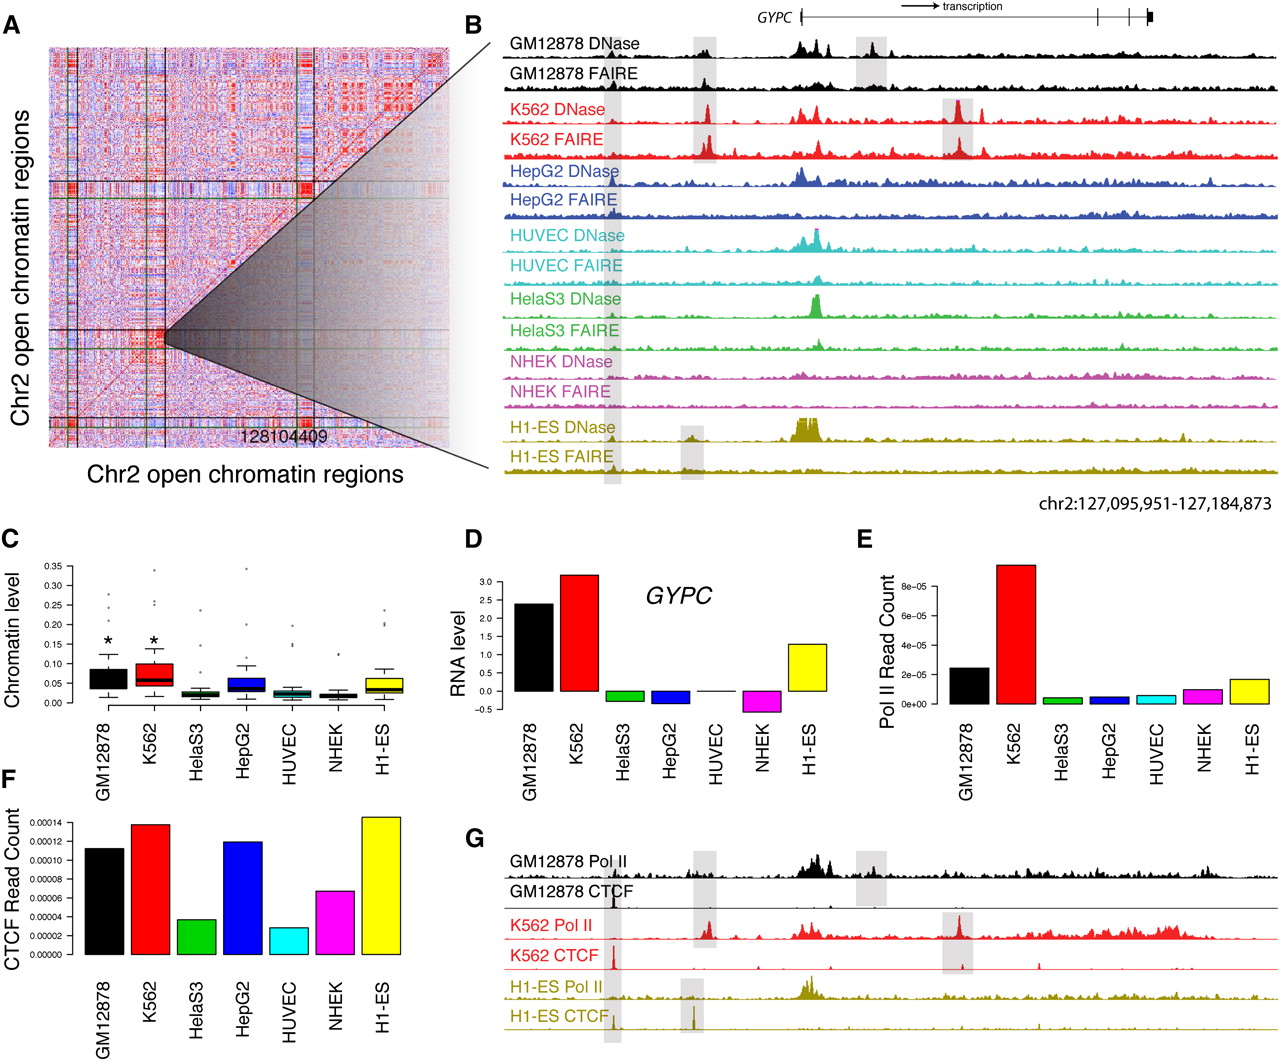
Open chromatin patterns form clusters of open regulatory elements (COREs). (A) Pairwise correlations between 500 open chromatin sites from chromosome 2 show three blocks of correlated sites (see Methods). Each row and column represents an open chromatin region found by both DNase-seq and FAIRE-seq in at least one of the seven cell types. Red indicates high correlation, white indicates no correlation, and blue indicates negative correlation. Vertical and horizontal lines show CORE boundaries. (B) DNase-seq (y-axis fixed at 0.1) and FAIRE-seq (y-axis fixed at 0.04) signals for a 90-kb subsection of CORE 98 containing the GYPC gene. GYPC is the only gene in this CORE. Highlighted are open chromatin sites found in all cell types, only GM12878 and K562 together, and GM12878 and K562 individually. (C) Boxplots show the distributions of open chromatin levels within open chromatin sites with CORE 98. GM12878 and K562 both have significantly higher levels of open chromatin (*; Mann-Whitney Wilcoxon rank sum test). (D) Relative expression levels (y-axis) of GYPC show increased expression in GM12878 and K562 cell lines. (E) Open chromatin sites within CORE 98 also show higher normalized Pol II ChIP-seq read counts in GM12878 and K562 cell types. (F) Normalized CTCF ChIP-seq read counts do not show significant differences between GM12878 and K562 and other cell types CORE98. (G) Pol II and CTCF signals in this 90-kb region (shown in B) provide preliminary annotations of similar and differential open chromatin sites.


