
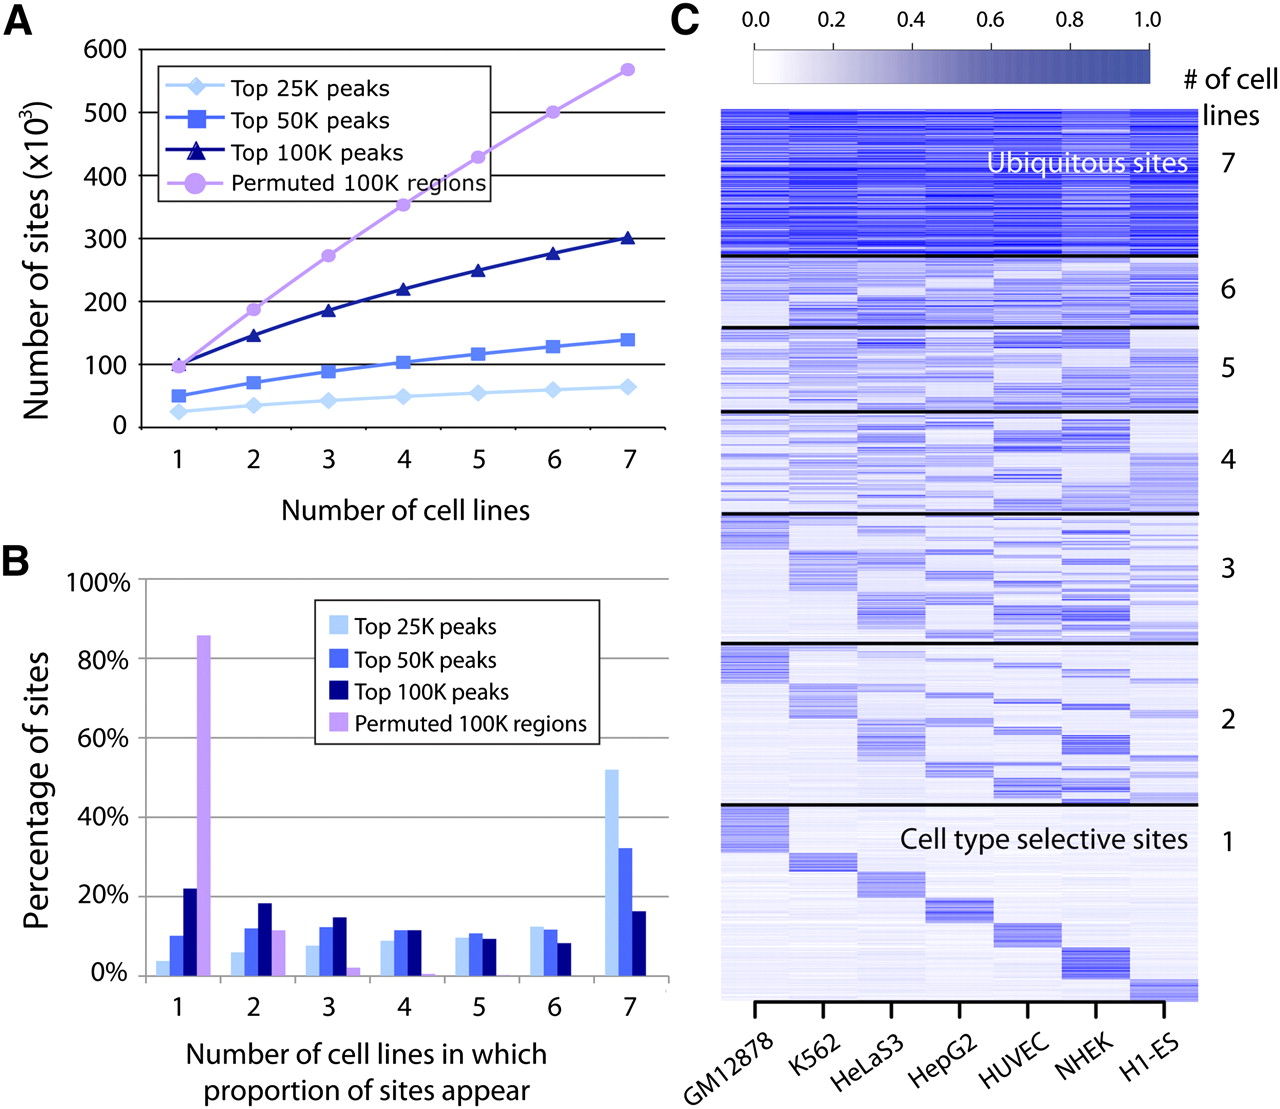
Distribution of open chromatin regions across cell types. (A) Saturation of total open chromatin sites discovered as a function of the number of cell types tested (x-axis). The rate of new top 25K sites per cell type was lower than for top 50K and 100K sites, likely reflecting more ubiquitous sites in this top fraction. (B) Percentage of the top 25K, 50K, and 100K combined open chromatin sites (y-axis) detected in one to seven of the cell types tested (x-axis). Over 50% of the top 25K open chromatin sites were ubiquitous, while more top 50K and 100K peaks were cell type selective. (C) Top 100K combined open chromatin sites partitioned by number of cell types in which they appear (y-axis). Color intensity indicates strength of open chromatin signal in that cell type.


