
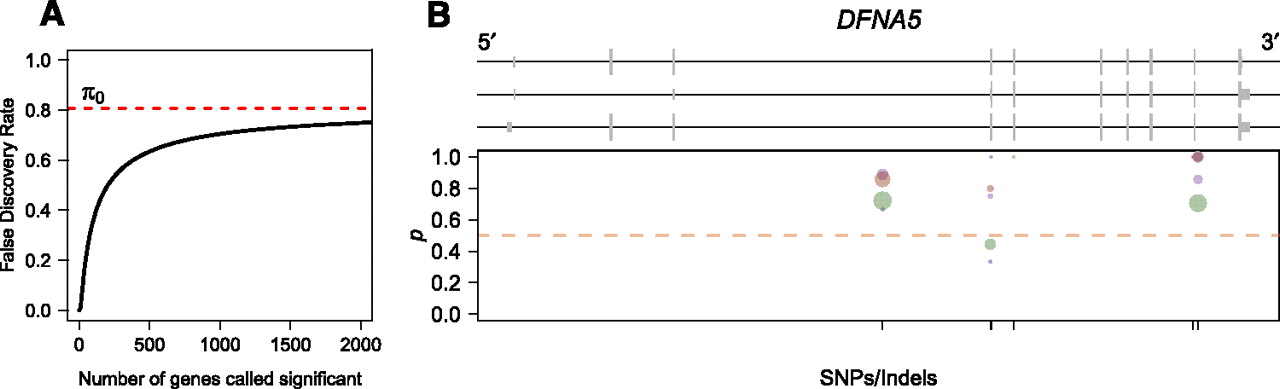
ASE in the human genome. (A) Plot of the false-discovery rate as a function of the number of genes called significant. Since the human RNA-seq data set is low coverage for most genes, it is not possible to identify many genes showing significant ASE without risking a relatively large proportion of false discoveries. (B) Human gene DFNA5, which shows significant ASE in individual NA18498. Plot is organized identically to Figure 5, B and C, with different colored dots representing measurements obtained from separate Illumina sequencing lanes. Although the number of reads is low for any given dot, the proportion of reads from allele one is consistently higher than that for allele two.


