
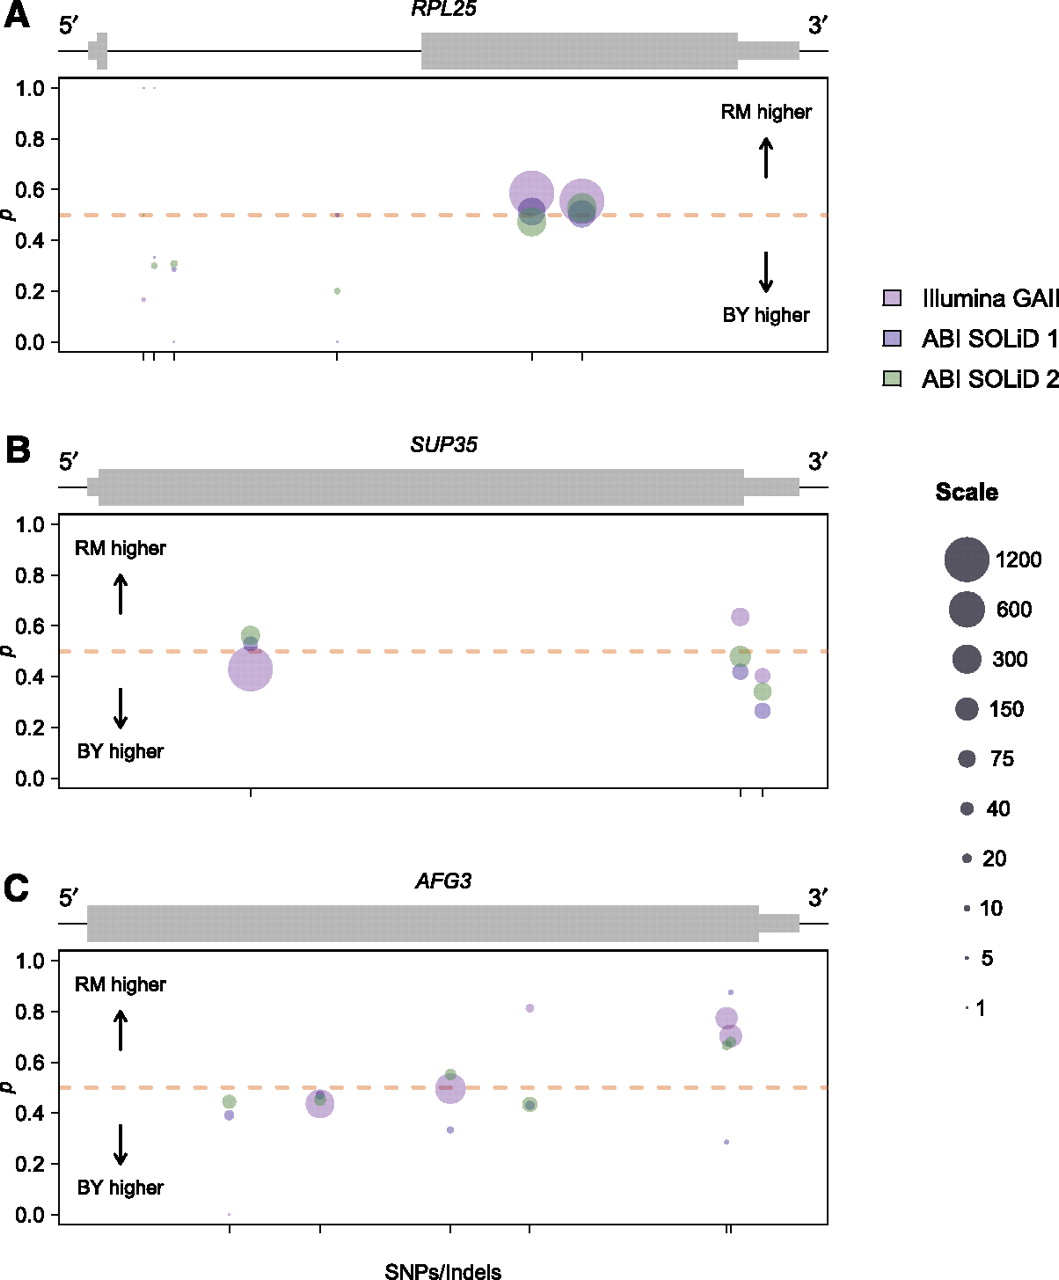
Examples of genes showing variable ASE. Plots are organized and colored identically to Figure 5, B and C. (A) Allele-specific read counts for the gene RPL25. Thin black line represents both intronic and intergenic sequence. Read counts indicate reproducibly equal expression in exon two of the gene, but expression biased in favor of the BY allele at four SNPs within the intron, consistent with allele-specific differences in splicing. (B) Allele-specific read counts for the gene SUP35. Higher expression of the BY allele at a SNP in the 3′ UTR suggests allele-specific variation in UTR length. (C) Allele-specific read counts for the gene AFG3. Higher expression of the RM allele near the 3′ end of the gene is consistent with allele-specific variation in transcript structure that could occur some distance away from the SNP tagging the ASE.


